





/ Projects
SwallowImaginariumFraudscape
/ Studio
AboutGet in touch
< Projects
\\
Swallow

Pricing infrastructure, designed from the ground up

Swallow brought me in to evolve its visual identity, website and MVP. As the business grew, I joined full-time, becoming the company’s sole designer and a close partner across product, brand and user experience

Brand
Identity & tone reset for a serious category
Web
Marketing site rebuilt around trust and clarity
Product
USER JOURNEYS, FLOWS + PLATFORM REDESIGNED END TO END
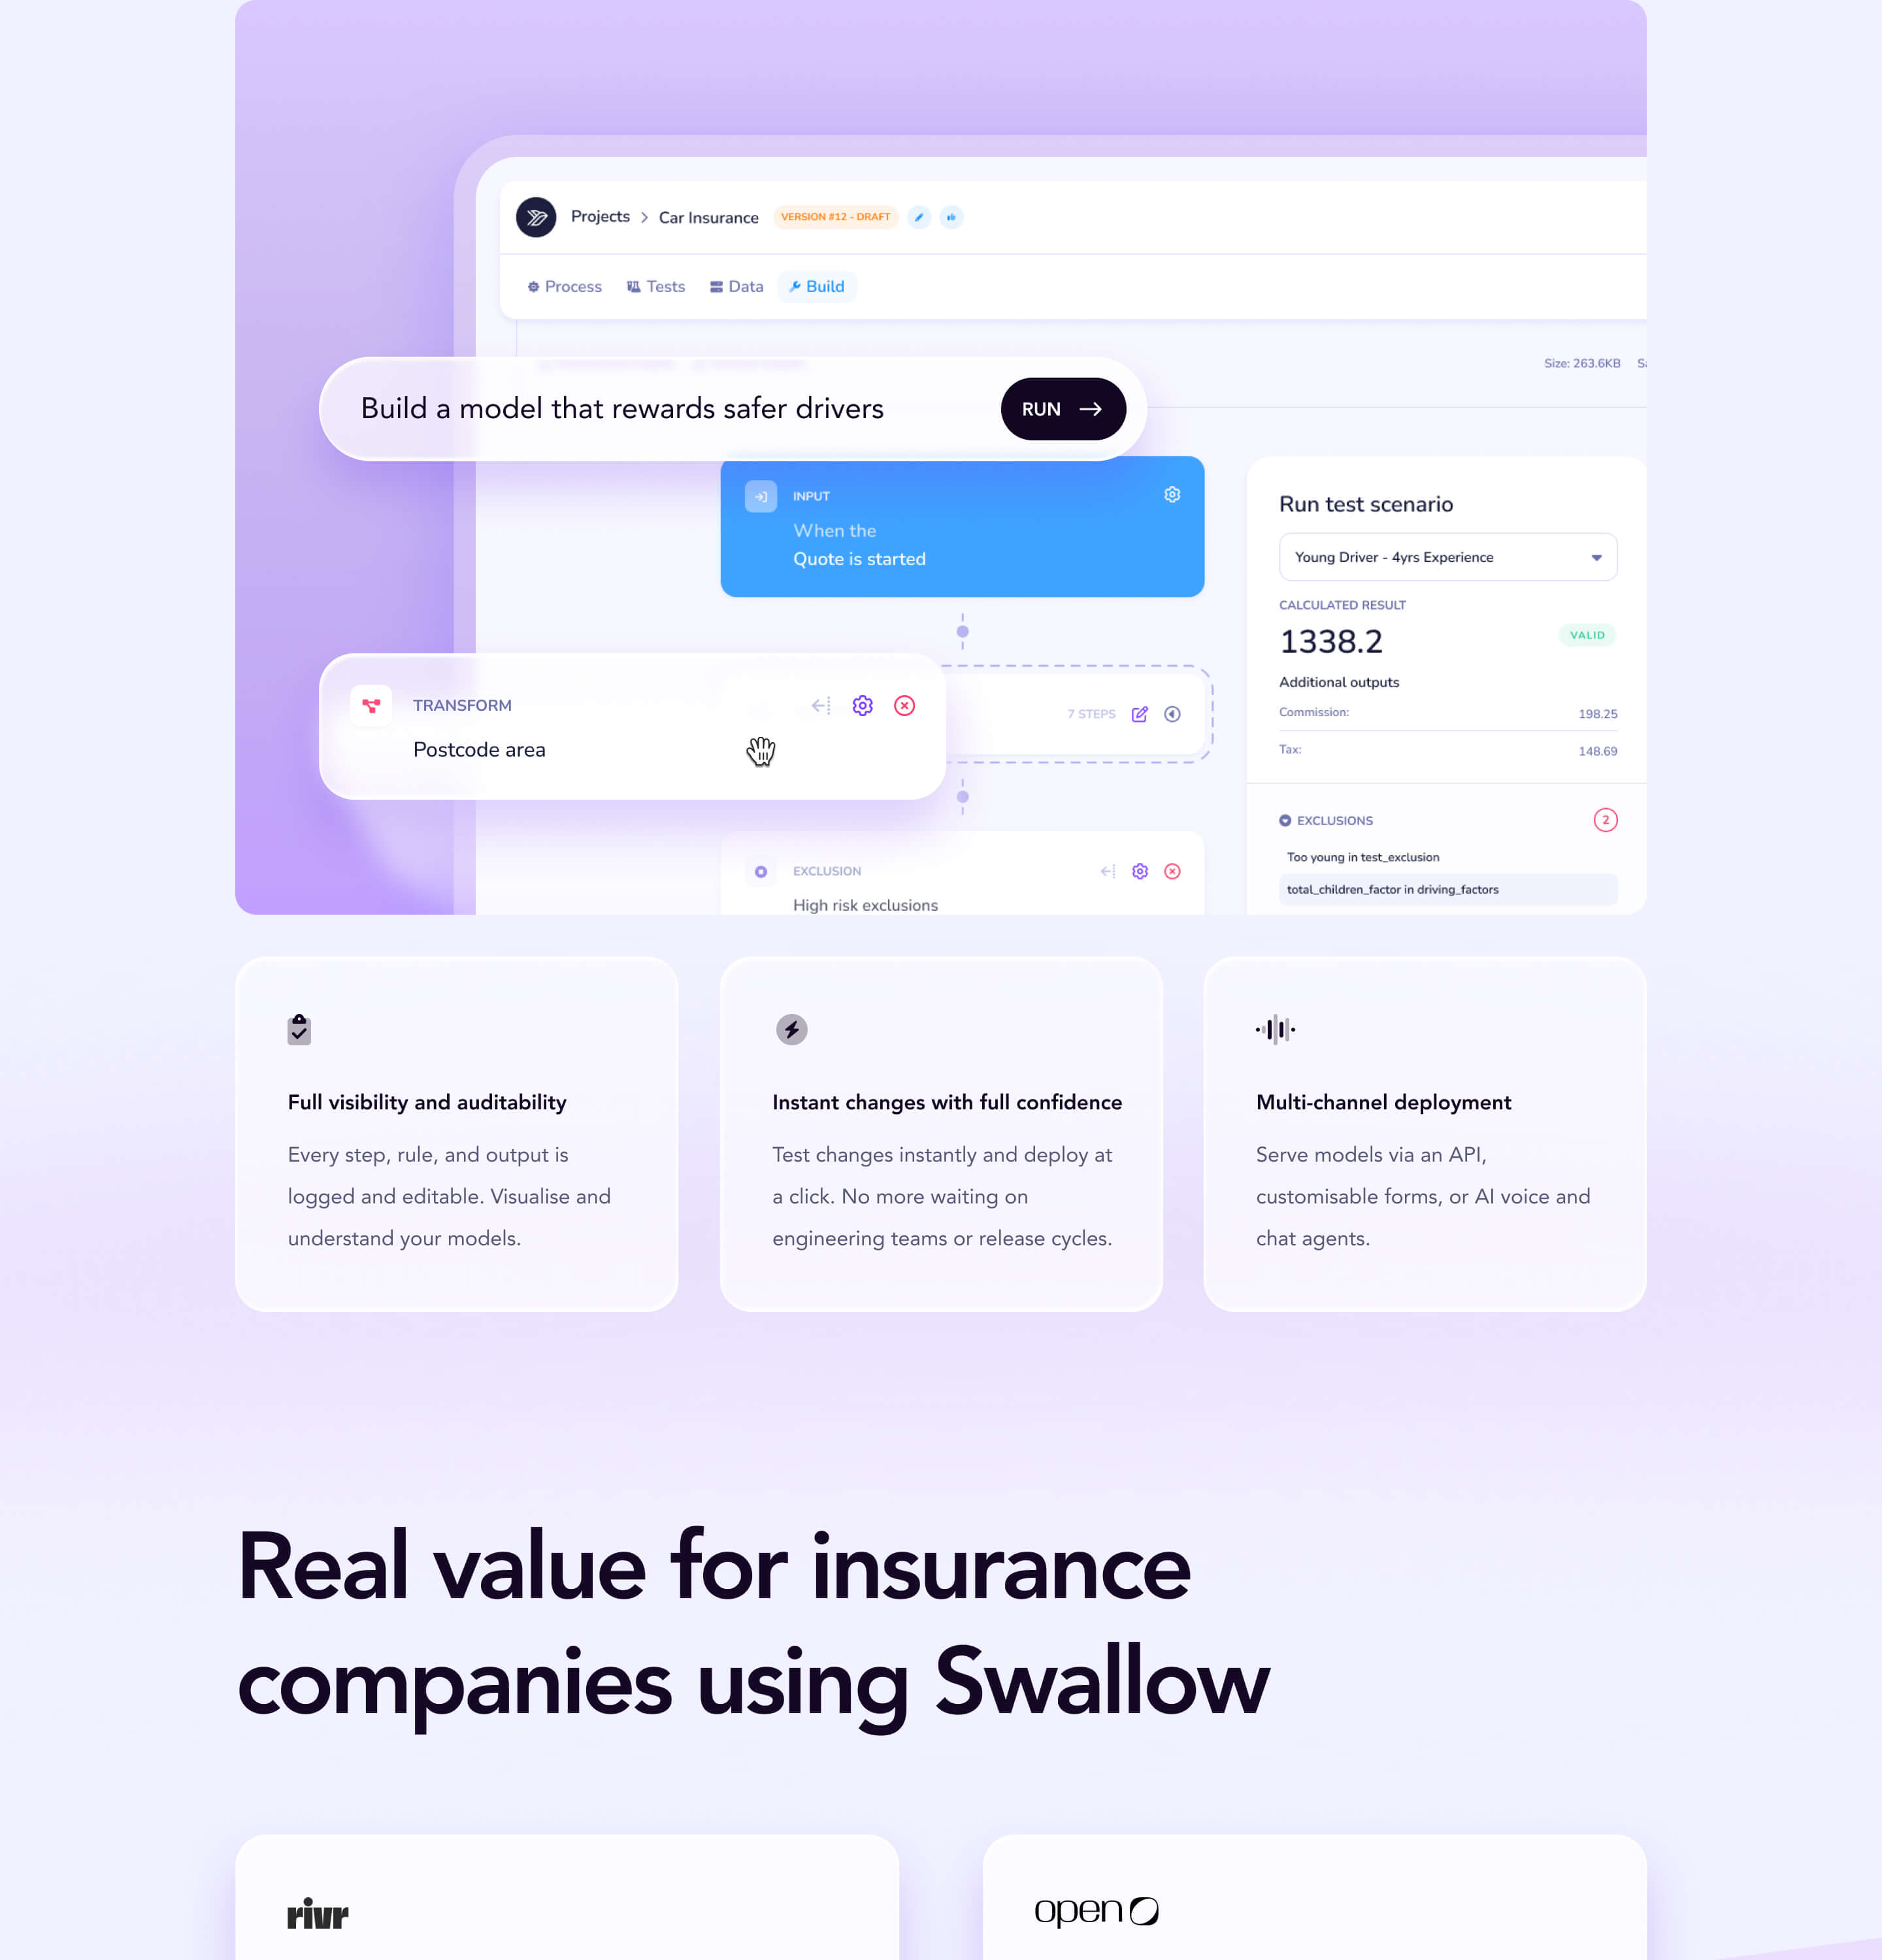
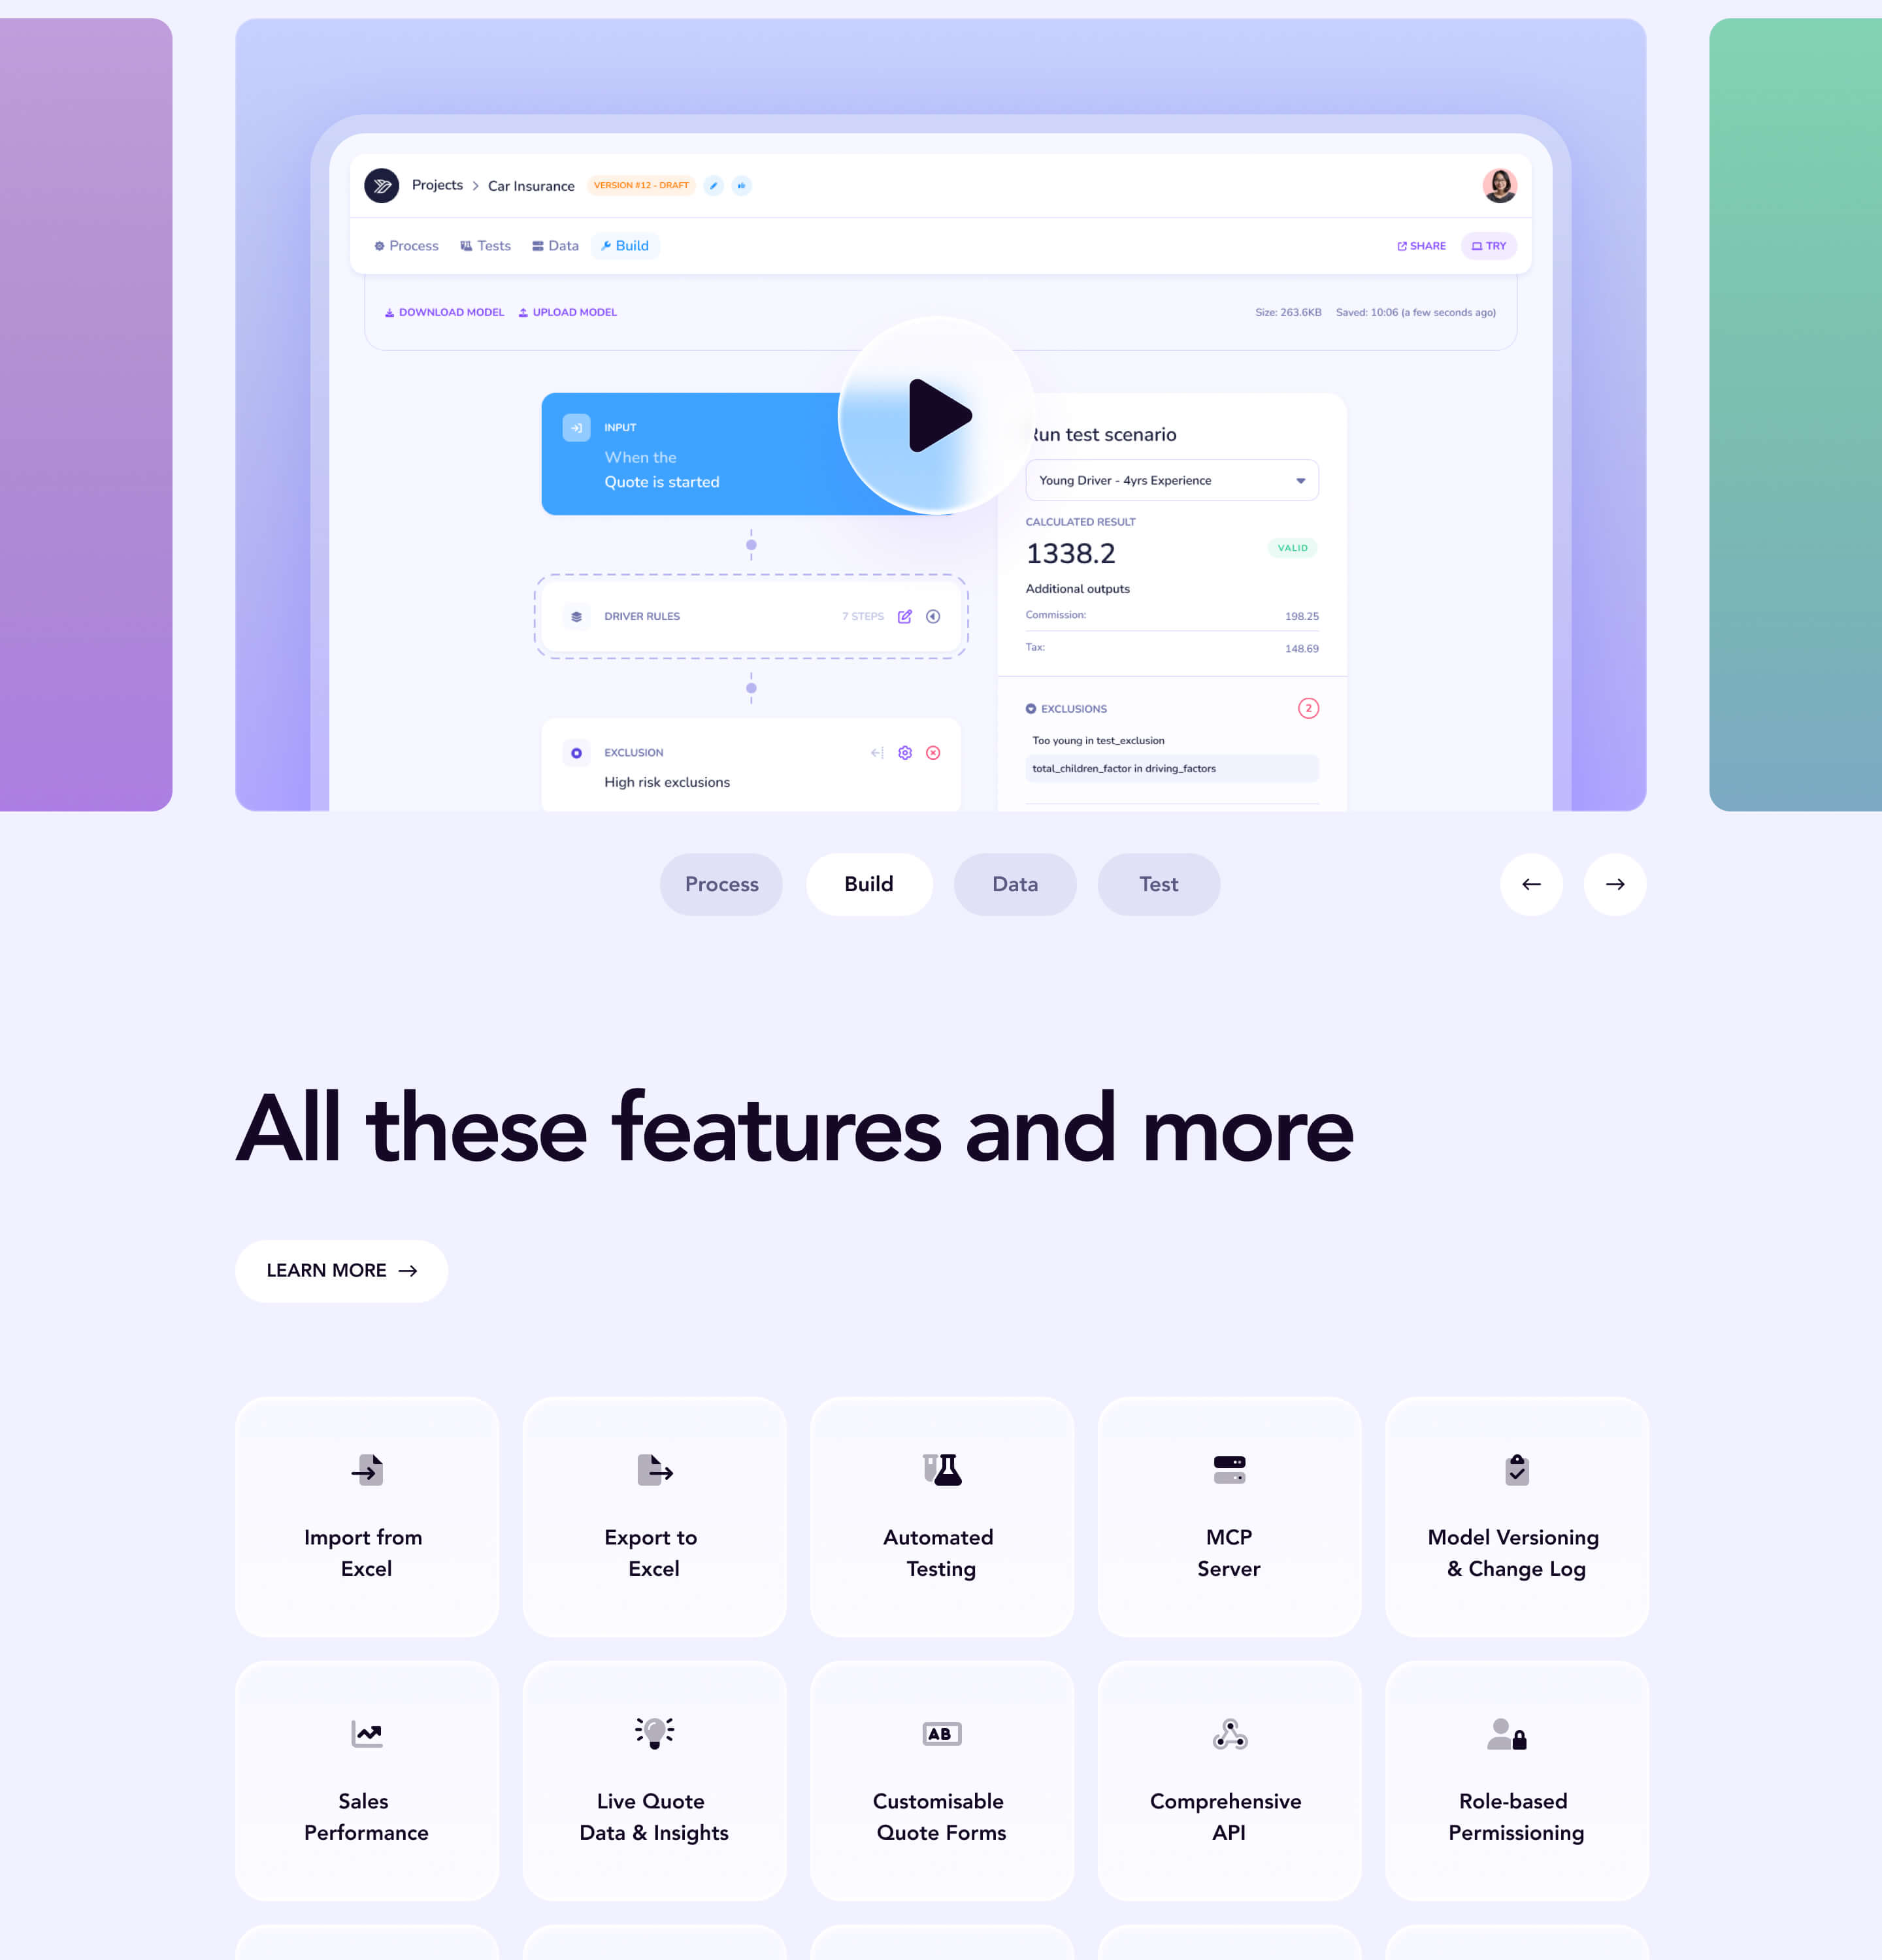
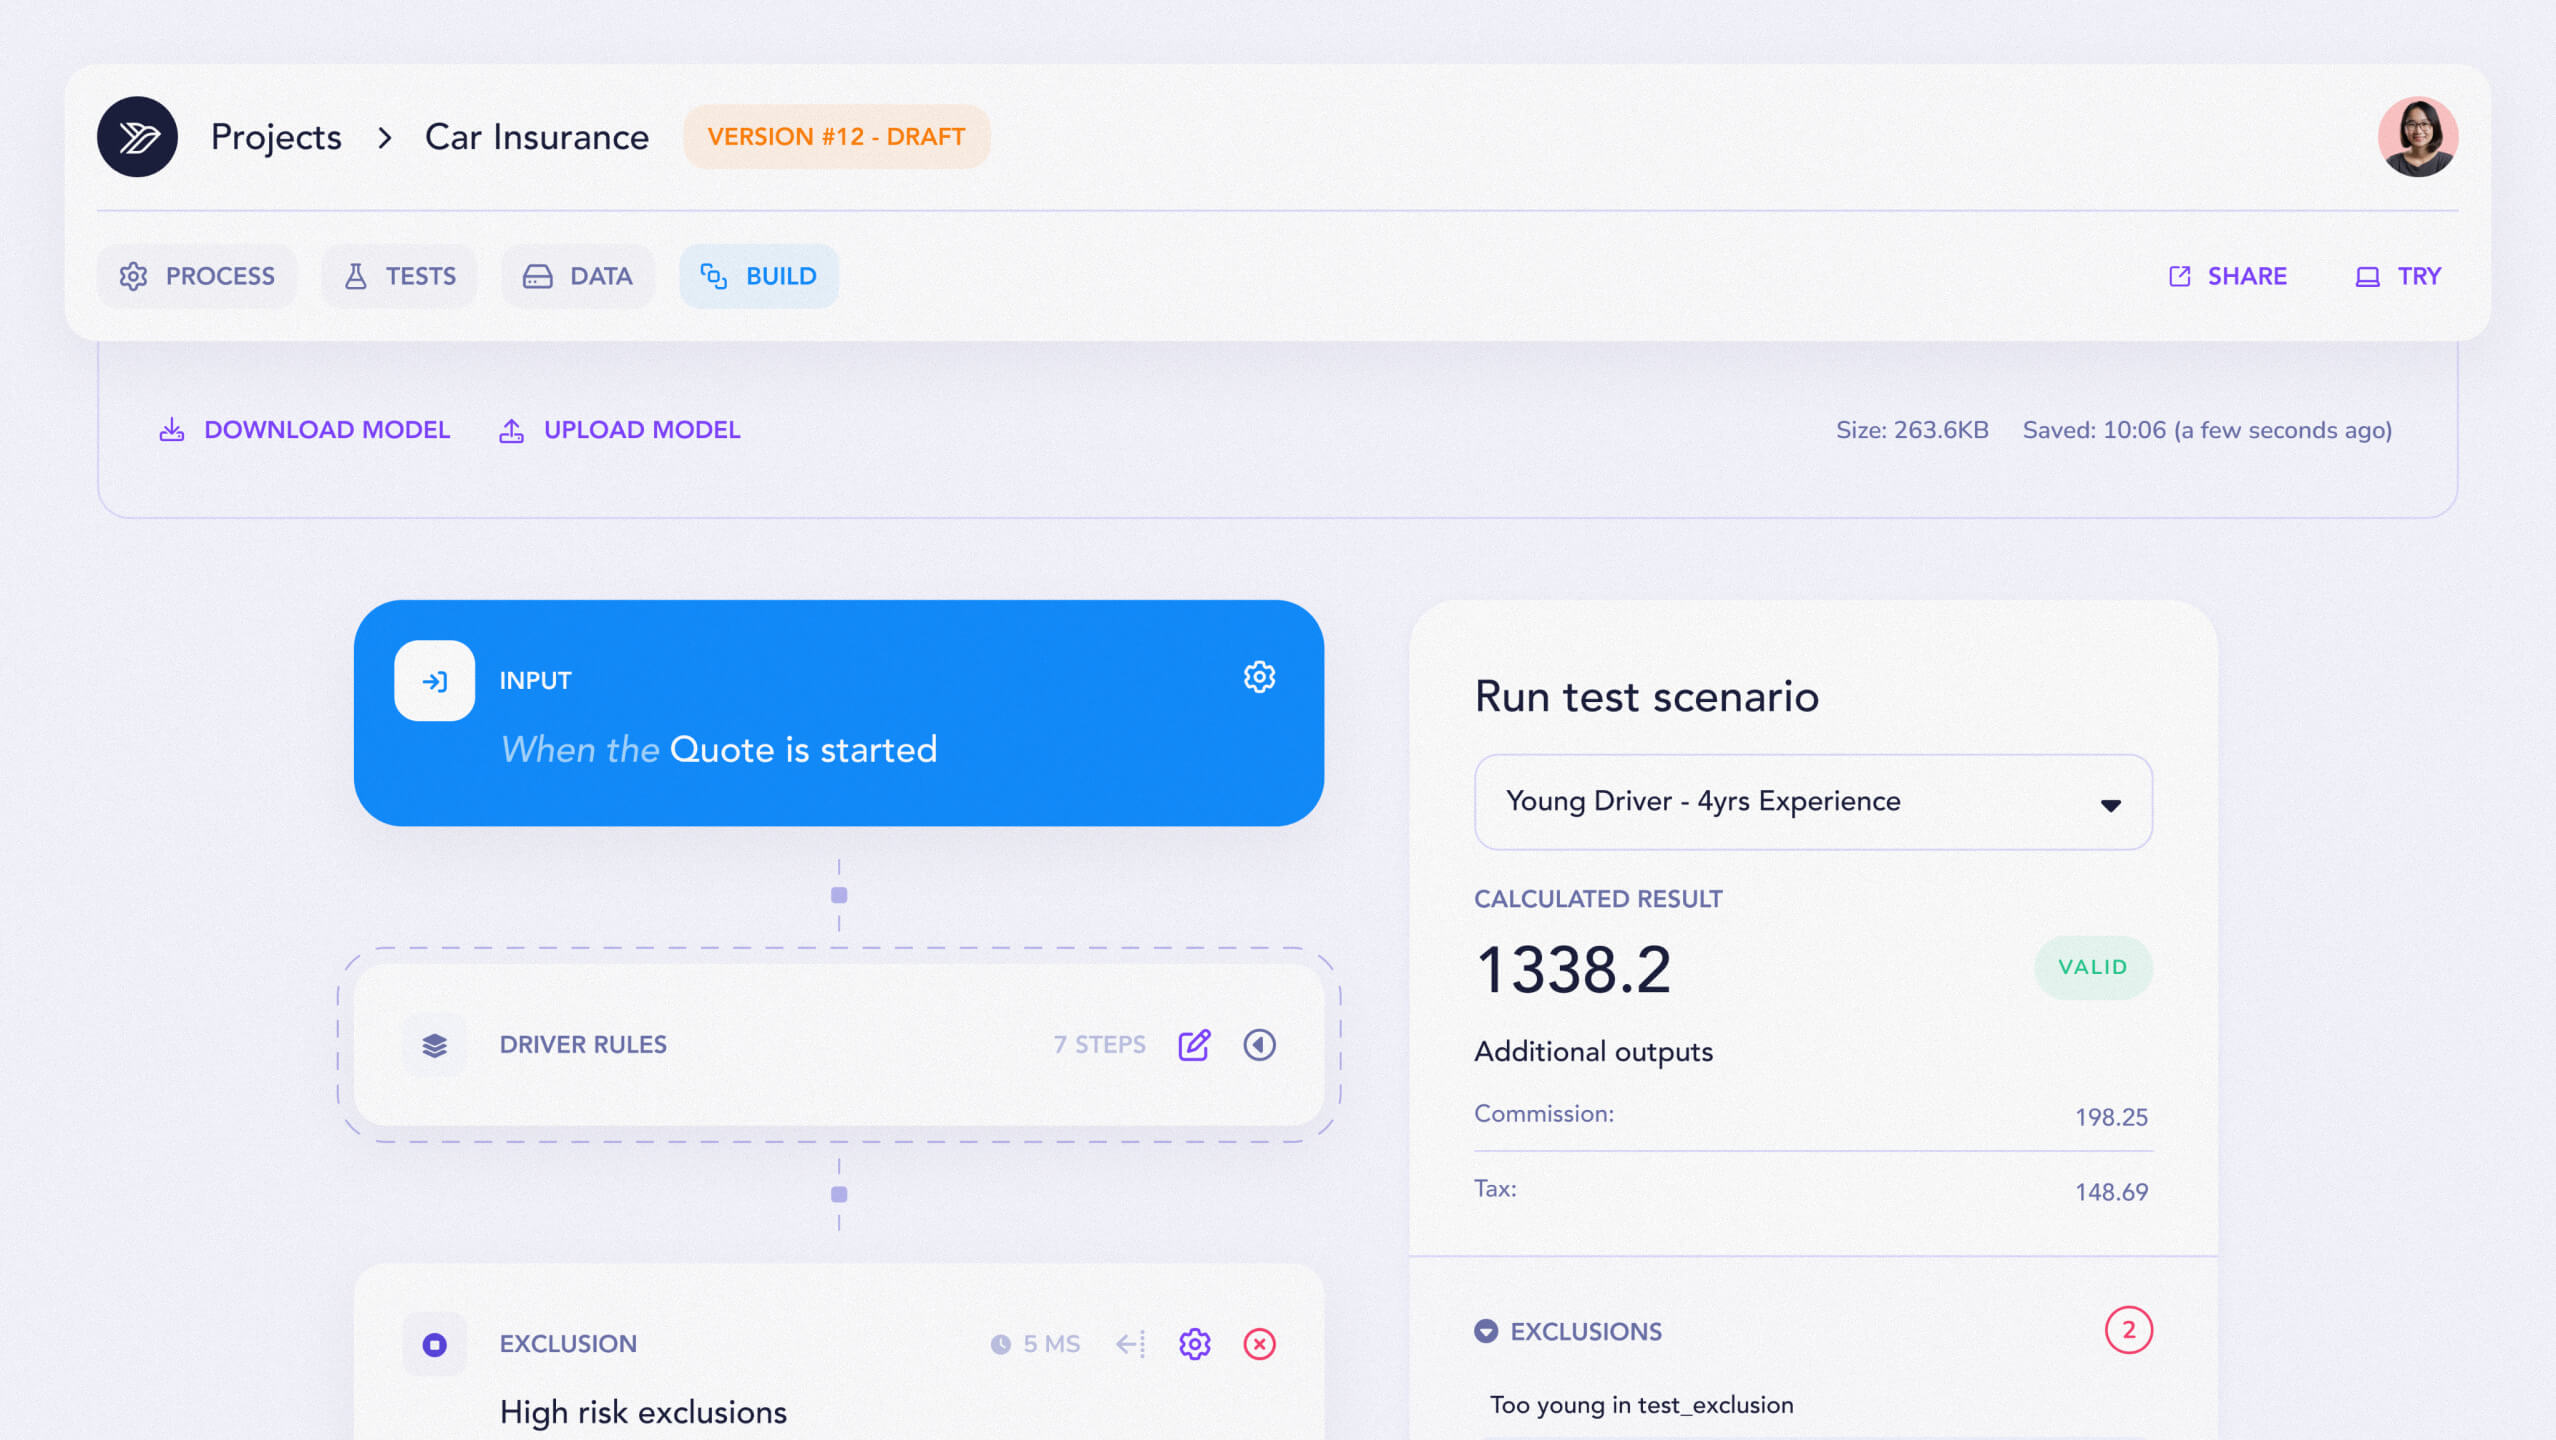
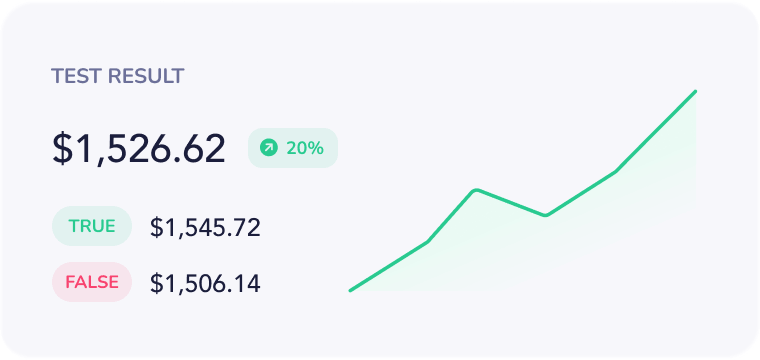
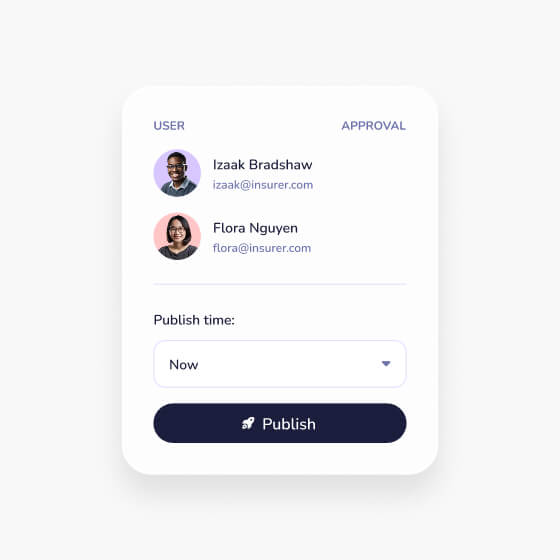
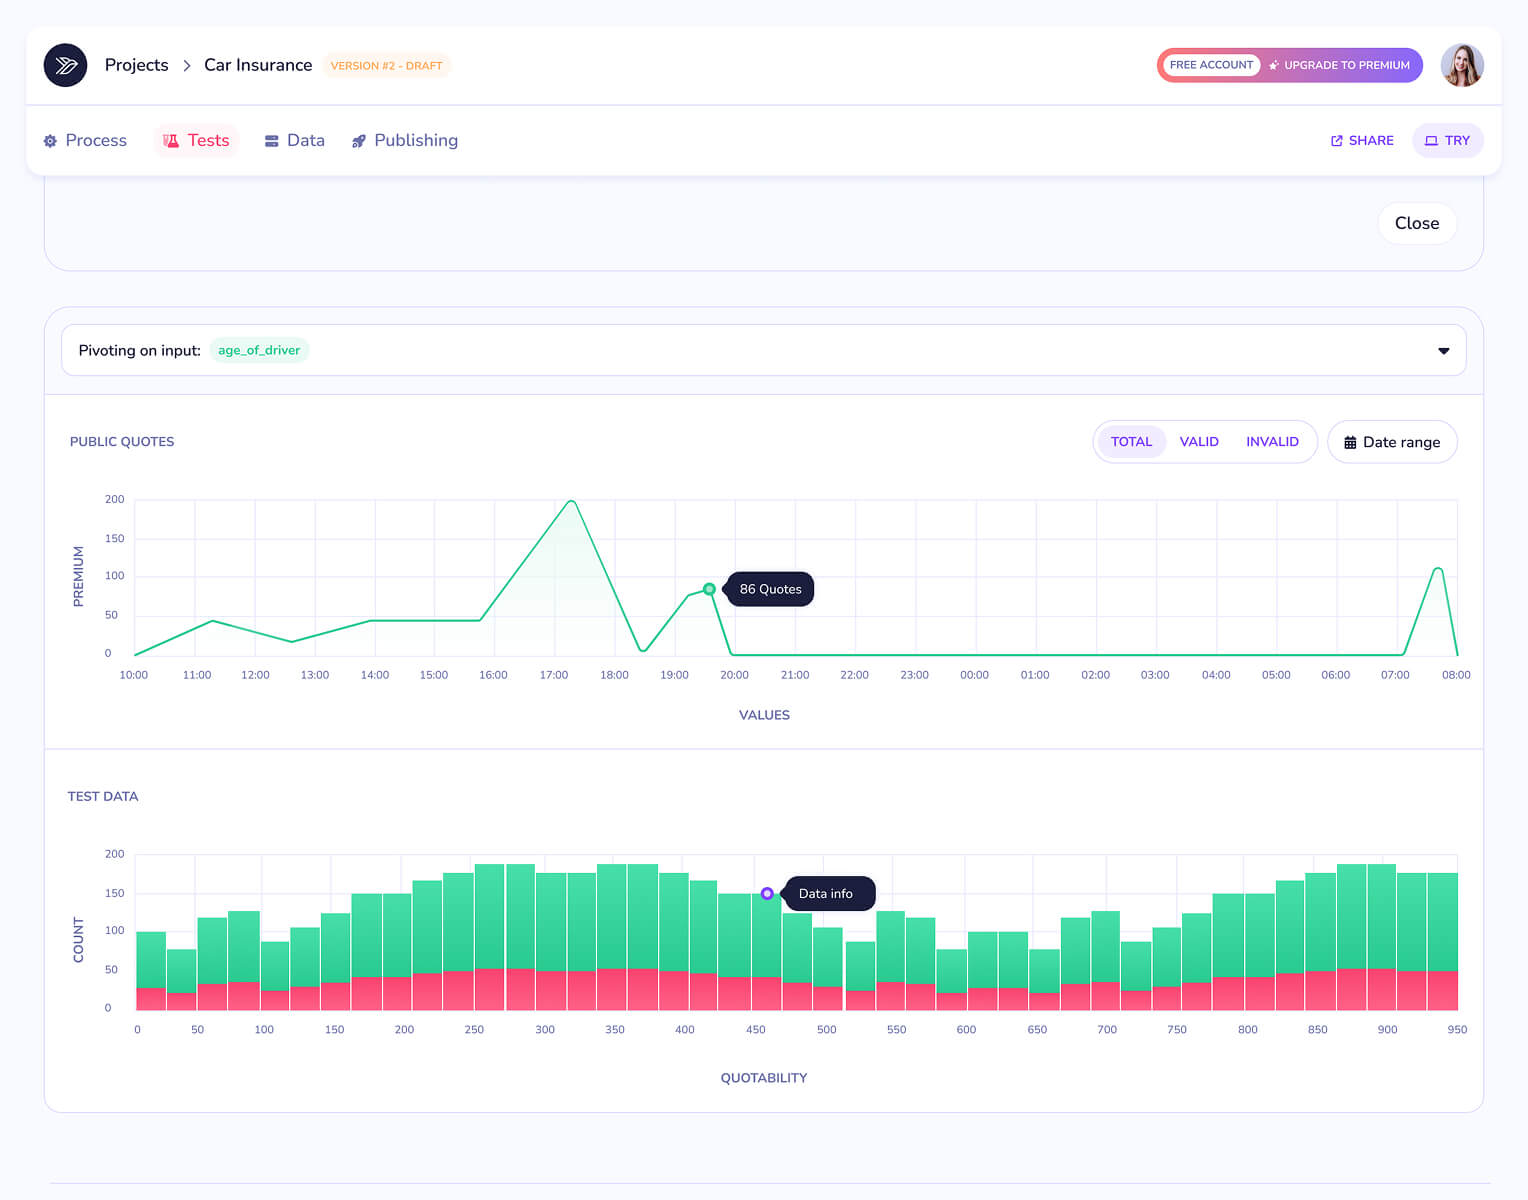
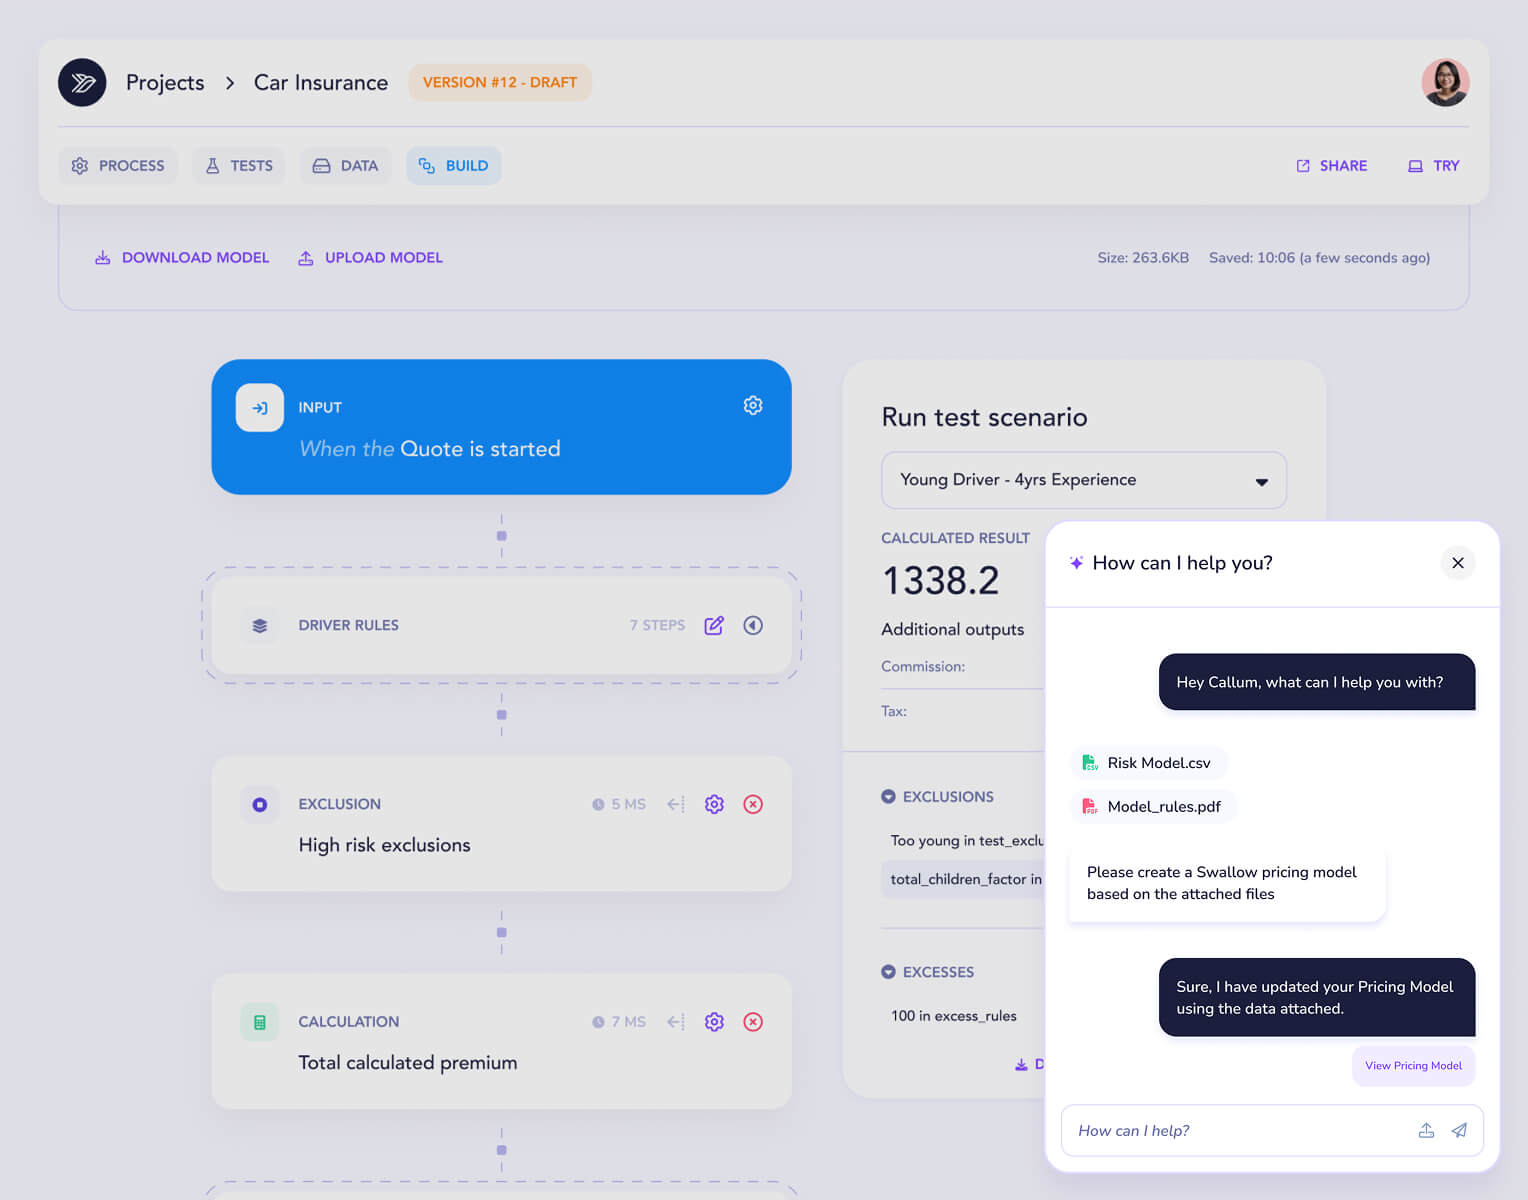
User interface of a car insurance project showing a workflow builder with steps including an input labeled 'When the Quote is started,' driver rules with 7 steps, and a high-risk exclusion rule. On the right, a test scenario for a young driver with 4 years experience displays a calculated result of 1338.2 marked valid, with additional outputs for commission and tax, and two exclusions listed including 'Too young in test_exclusion.' Options to download or upload the model and buttons to share or try are visible at the top.User approval interface showing two users, Izaak Bradshaw and Flora Nguyen, each with a profile picture, email address, and an active approval toggle. Below is a dropdown menu set to 'Now' for publish time and a dark button labeled 'Publish' with a rocket icon.Test result card showing a main value of $1,526.62 with a green upward arrow and 20% increase. Below are two values labeled TRUE at $1,545.72 in green and FALSE at $1,506.14 in red, alongside a rising green line graph.

Take insurance pricing out of the developer queue

Swallow set out to give pricing teams a faster way to build, test and deploy rating engines without waiting on developers. My role was to turn that ambition into a product that made sophisticated pricing workflows feel clear, fast and dependable.

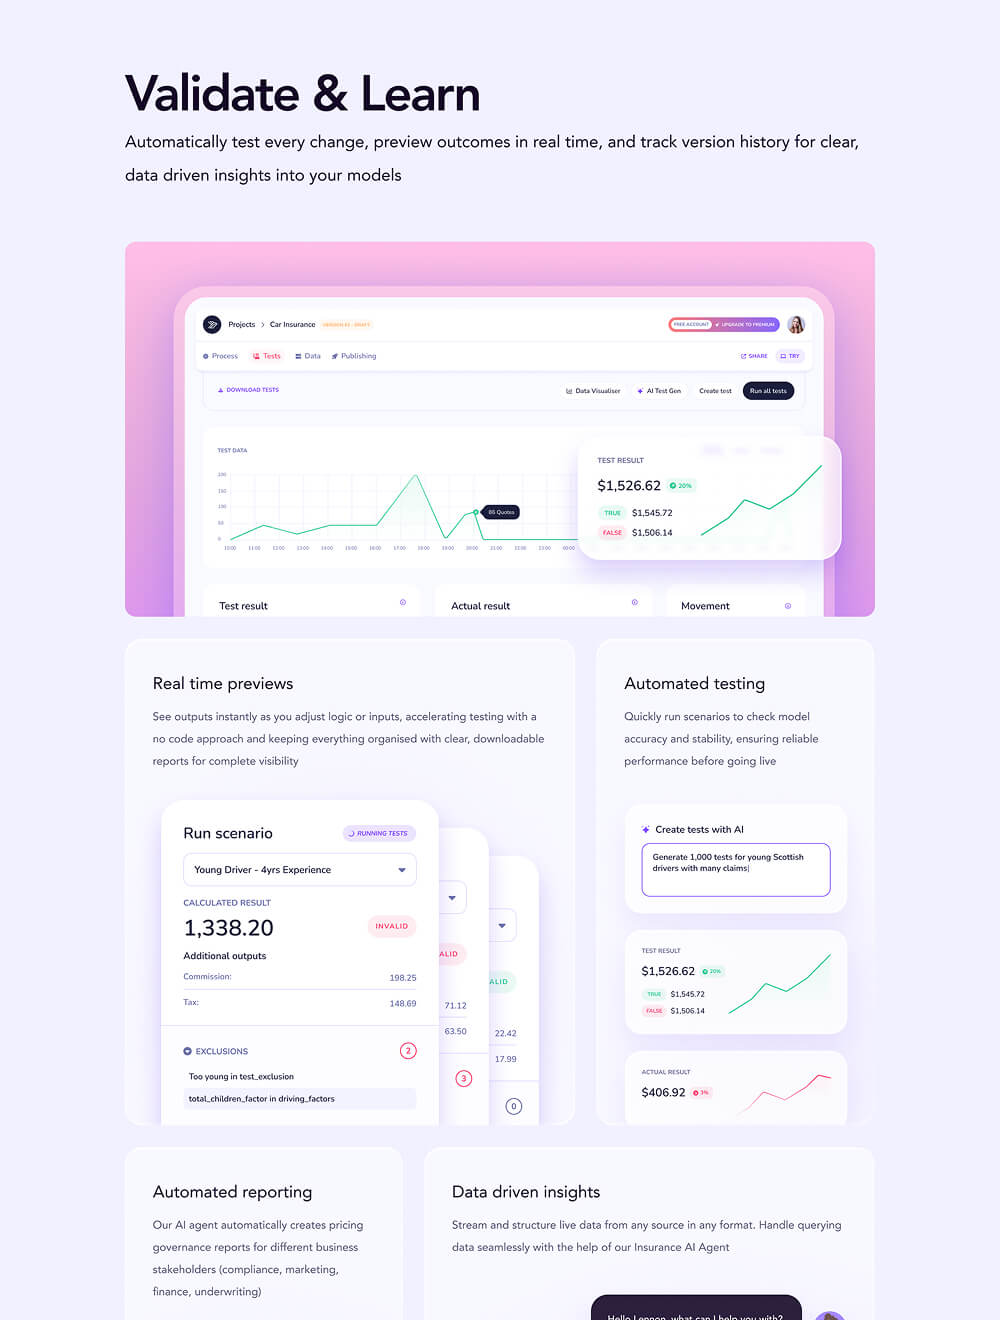
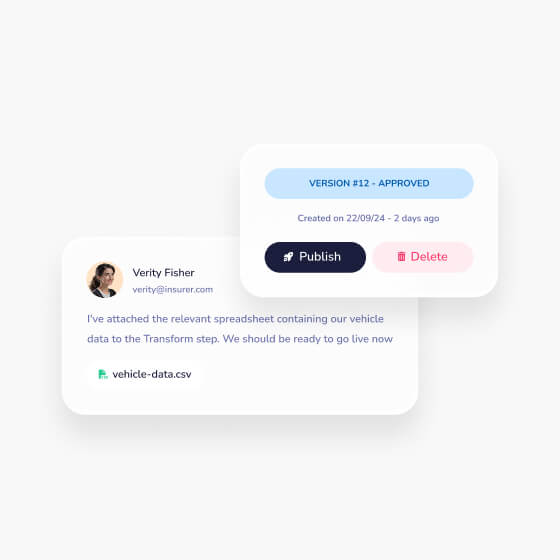
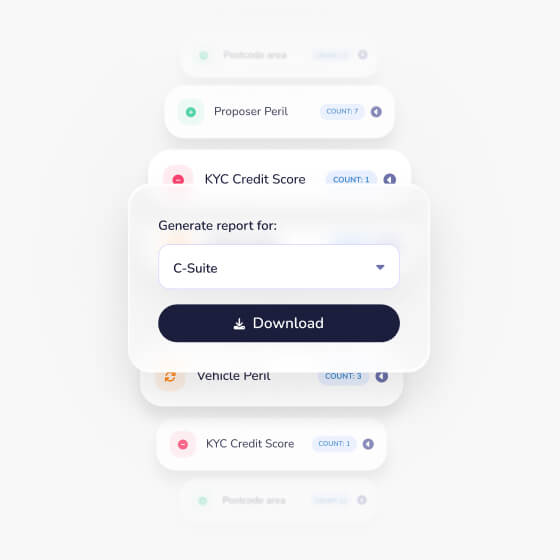
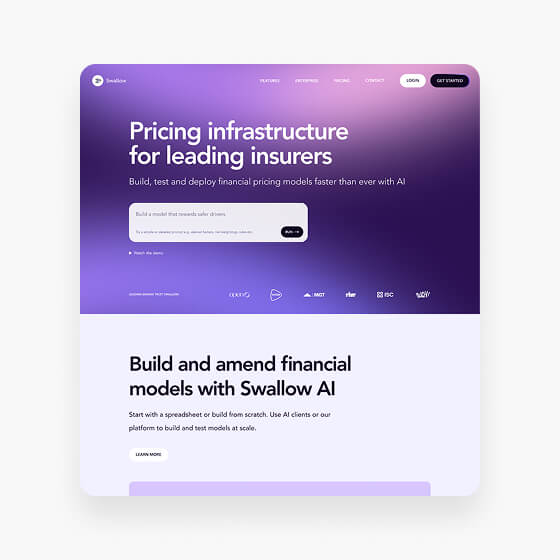
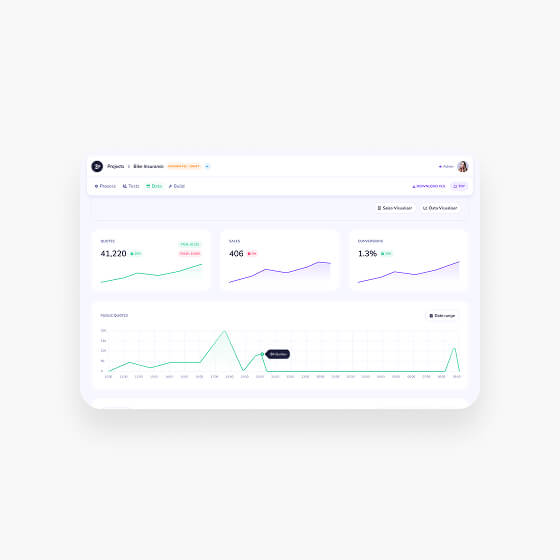
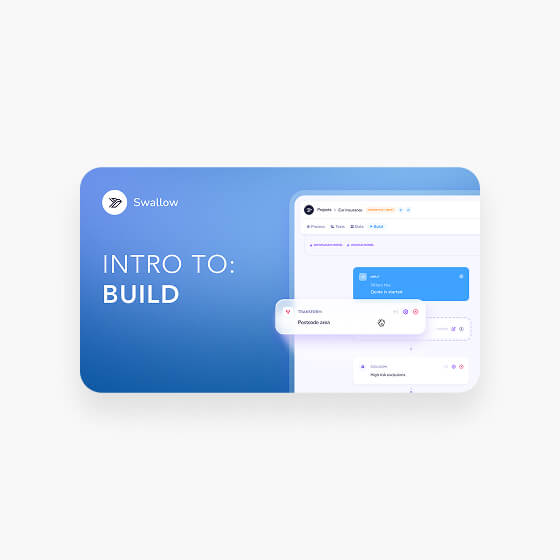
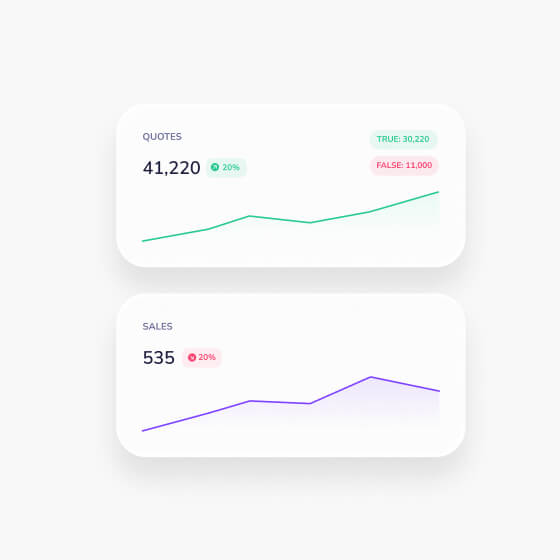
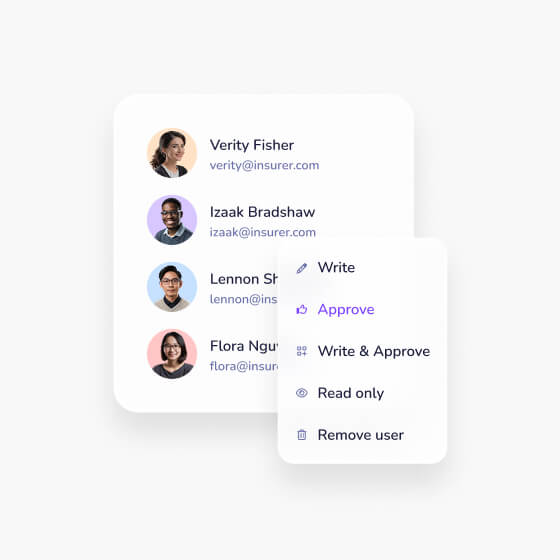
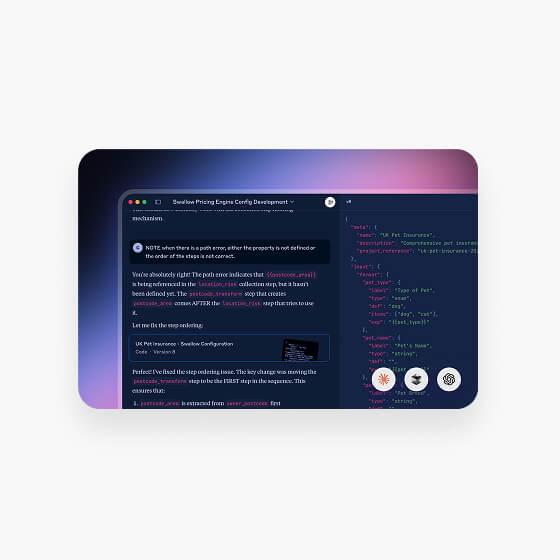
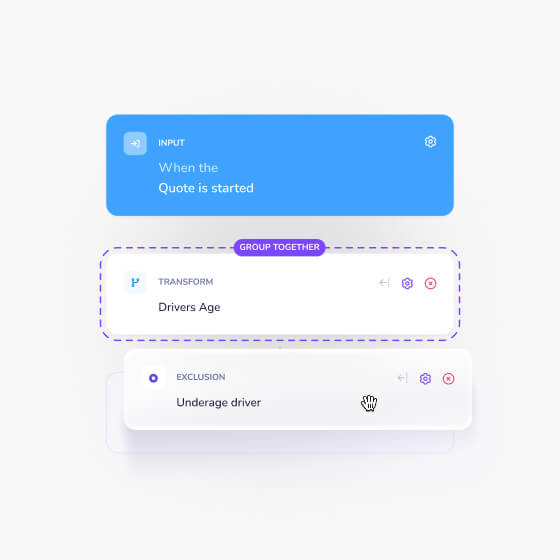
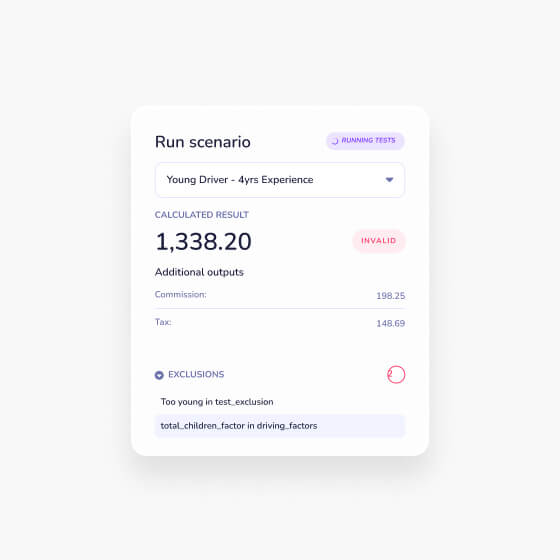
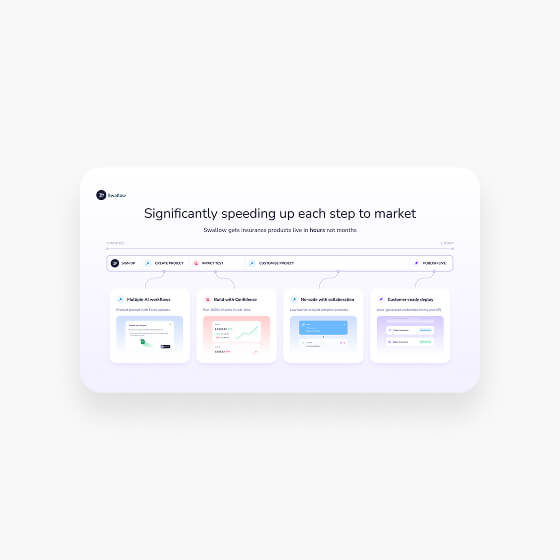
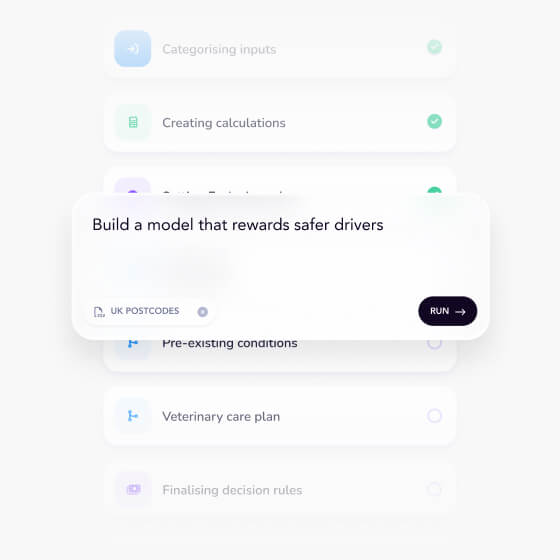
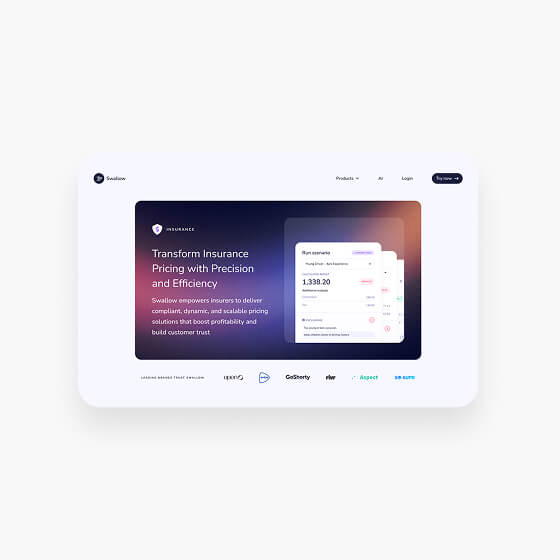
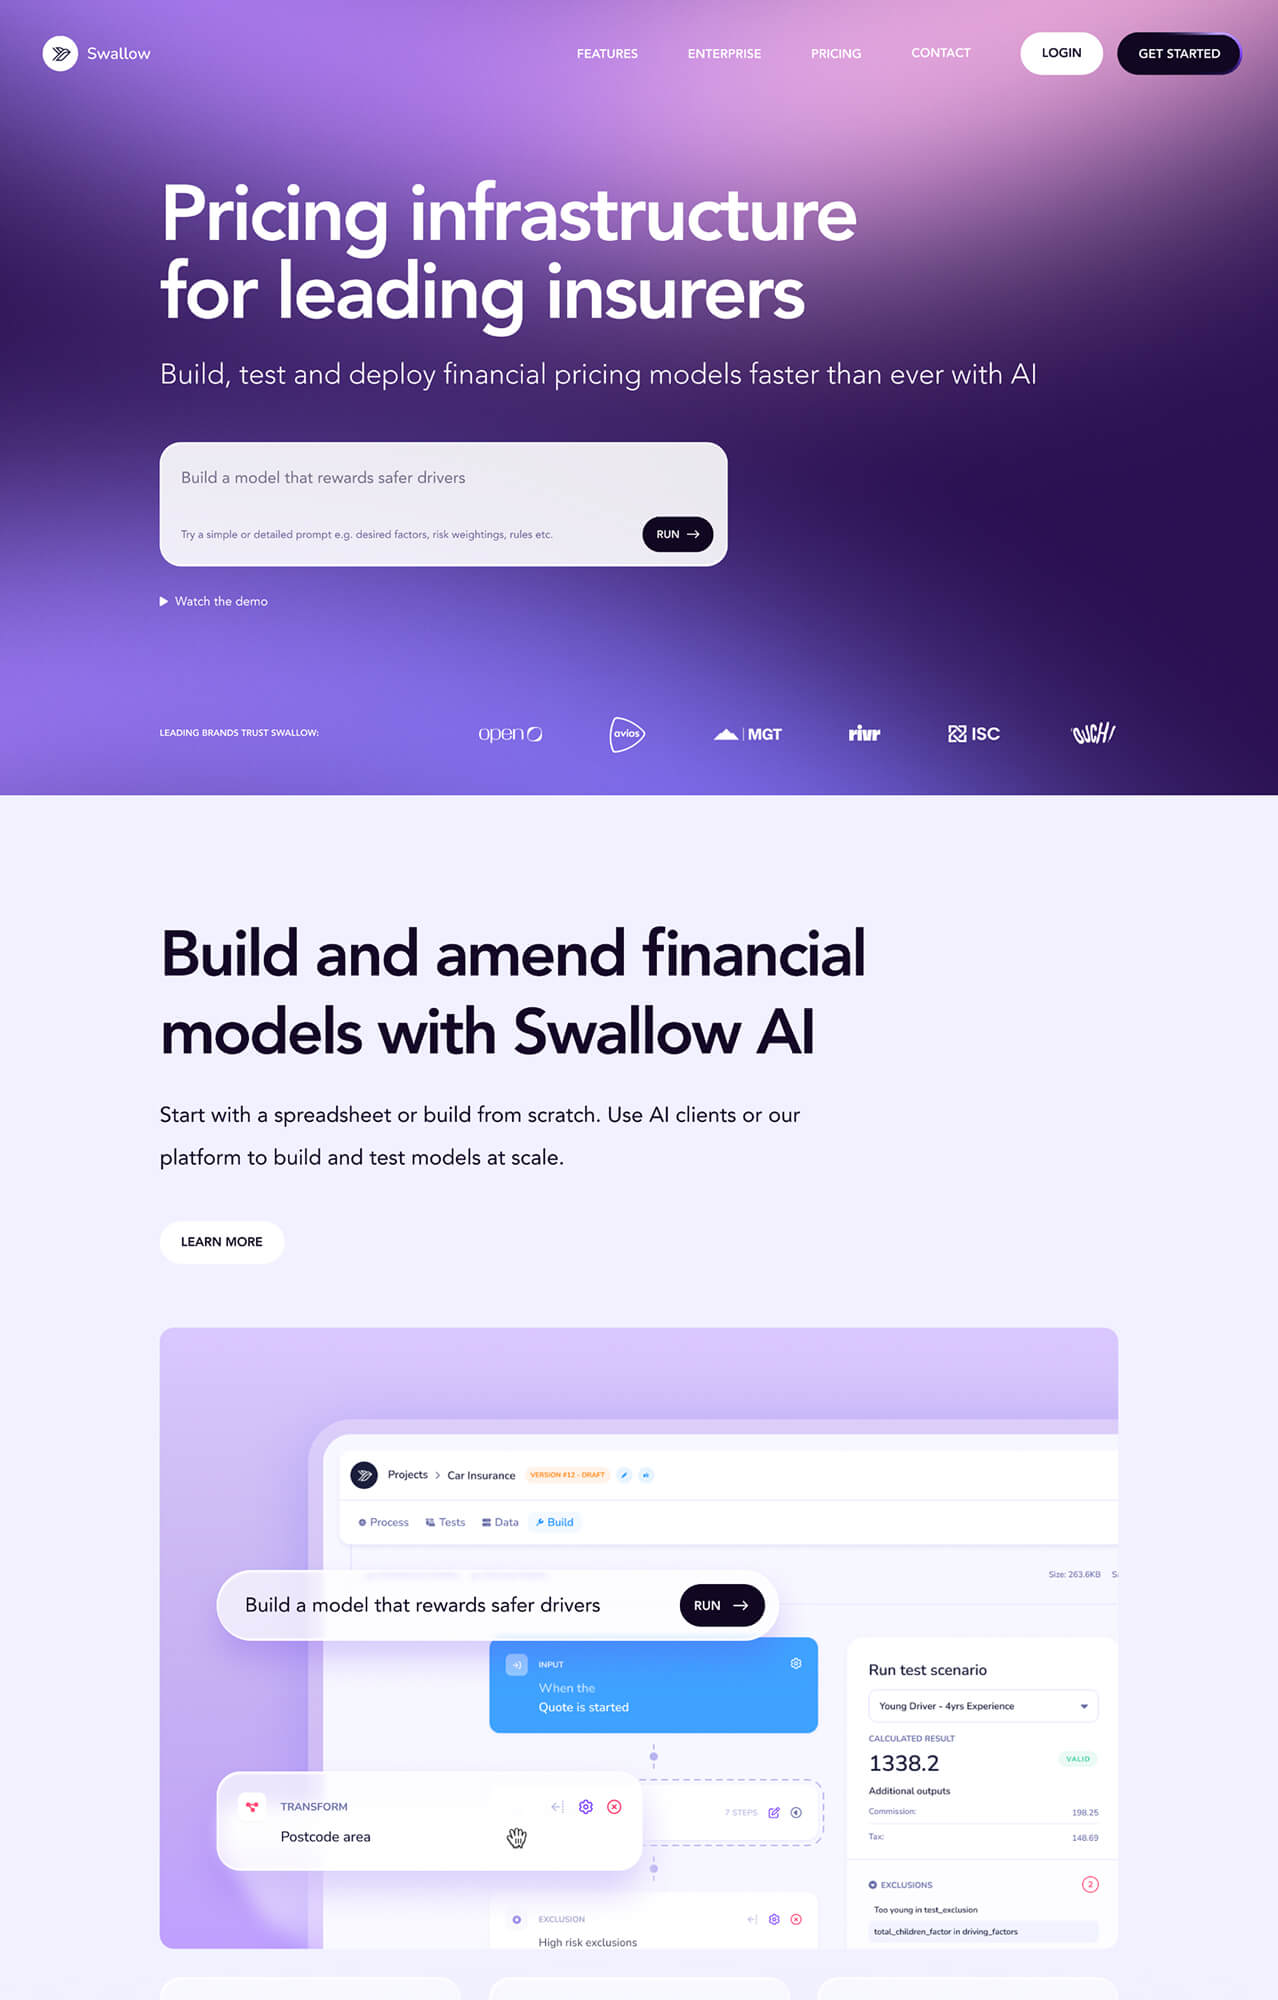
User interface showing a message from Verity Fisher with her profile photo and email, stating she attached a vehicle data spreadsheet named vehicle-data.csv for the Transform step, alongside a popup indicating Version #12 - Approved, created 2 days ago, with buttons to Publish or Delete.User interface panel showing a dropdown menu labeled 'Generate report for:' with 'C-Suite' selected and a dark blue 'Download' button beneath it, surrounded by blurred report categories such as Proposer Peril, KYC Credit Score, and Vehicle Peril with associated counts.Website homepage for Swallow AI showing pricing infrastructure for insurers, with a purple gradient header offering AI-based financial pricing models and a section below about building and amending financial models using Swallow AI.Dashboard interface displaying three key metrics with line graphs: traffic at 41,220 with a rising trend, sales at 406, and conversion rate at 1.3%, plus a larger line graph below showing product orders over time with a highlighted data point.Simplified geometric bird icon in dark navy blue centered on a white circular background with subtle shadow.Blue and white interface screen with the Swallow logo and text 'Intro to: Build' alongside cards showing a project management or task-building tool with tasks like 'Postcode data' and 'Quote in market'.Two rectangular data cards with rounded corners. The top card titled 'Quotes' shows a total of 41,220 with a green label indicating a 20% increase and two smaller colored labels: green for TRUE 30,220 and red for FALSE 11,000. A green ascending line graph is below the text. The bottom card titled 'Sales' shows 535 with a red label indicating a 20% decrease and a purple line graph below with a fluctuating ascending trend.User interface showing a list of four users with names, photos, and email addresses, and a dropdown menu with options: Write, Approve, Write & Approve, Read only, and Remove user.Computer screen showing code editor with a dark-themed interface displaying JSON code and markdown text related to Swallow Pricing Engine Config Development on a purple gradient background.User approval interface showing two users: Izaak Bradshaw with email izaak@insurer.com and Flora Nguyen with email flora@insurer.com, a dropdown to select publish time set to 'Now,' and a dark blue publish button with a rocket icon.User interface design showing examples of buttons and links including primary buttons in dark blue, secondary buttons with outlines, secondary icons, text links, caps links with checkboxes, and caps buttons in purple, alongside a set of purple icons representing various functions such as pencil, microphone, and bell within a dashed layout grid on a light background.Diagram showing a workflow with three connected blocks: a blue input block labeled 'When the Quote is started', a transform block labeled 'Drivers Age', and an exclusion block labeled 'Underage driver', grouped together with a purple label 'Group Together'.User interface panel titled 'Run scenario' showing a dropdown menu set to 'Young Driver - 4yrs Experience' with a calculated result of 1,338.20 marked as invalid. Additional outputs listed include Commission: 198.25 and Tax: 148.69. Under exclusions, items are 'Too young in test_exclusion' and 'total_children_factor in driving_factors', with some icons for status next to them.Dashboard interface titled 'Validate & Learn' featuring a line graph showing test results and performance metrics, with sections for real-time previews and automated testing details.Chart titled 'Significantly speeding up each step to market' showing a timeline with four stages: Build MVP in a week or less, Test with Confidence, Re-scale with collaboration, and Customer-ready plugins, illustrating the process to get insurance products live quickly.User interface card with text 'Build a model that rewards safer drivers', a tag labeled 'UK POSTCODES', and a black 'RUN' button with an arrow, over a blurred background of checklist items.Website homepage featuring a section with the headline 'Transform Insurance Pricing with Precision and Efficiency,' describing how Swallow empowers insurers with scalable pricing solutions, accompanied by a UI screenshot showing pricing data. The site menu includes Products, AI, Login, and a 'Buy now' button, with logos of partner companies at the bottom.

Pricing stuck in spreadsheets

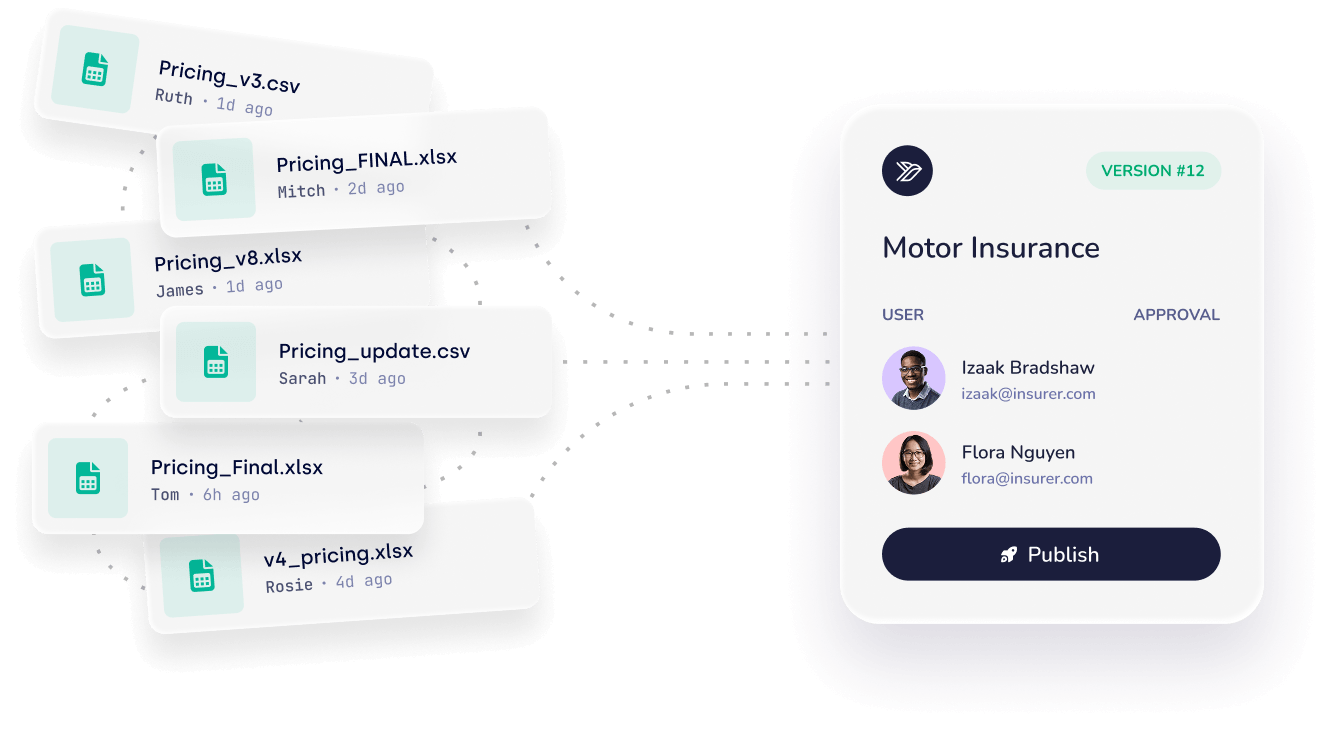
Pricing teams were managing critical logic across fragile spreadsheets and manual processes, leaving developers to turn every change into working software. What should have been controlled by the people closest to pricing had become slow to update, difficult to test and risky to deploy.

Illustration of multiple spreadsheet files on the left with names, authors, and modification times, connecting to a Motor Insurance approval interface on the right showing two users, Izaak Bradshaw and Flora Nguyen, with email addresses and a 'Publish' button.

Pricing logic was scattered across spreadsheets, making versions difficult to track and manage

Even simple pricing changes depended on engineering time to reach production

Manual testing and lengthy deployments made mistakes costly and updates slow

Client_Log
Authenticated

Working together was a game changer. Every part of our website, product design, UX, and branding felt carefully considered, with Josh creating a seamless experience that tied everything together beautifully

Callum Rimmer, Founder & CEO of Swallow
Callum Rimmer
Founder & CEO, Swallow

Bringing old-school pricing up to speed

Insurance pricing was still rooted in old-school spreadsheets and manual processes. I helped move that complexity into a clearer digital experience, building a visual language across Swallow’s product, website and brand that made sophisticated pricing infrastructure easier to understand, trust and use.

Vintage Macintosh SE computer displaying a spreadsheet titled 'Motor Insurance Pricing Model' with tables of age bands, vehicle groups, base rates, and premiums, alongside a bar chart of premiums by age band, on a desk with books on insurance, a coffee mug, a notebook with sketches, and a stack of floppy disks labeled 'Pricing Model v2.1'.
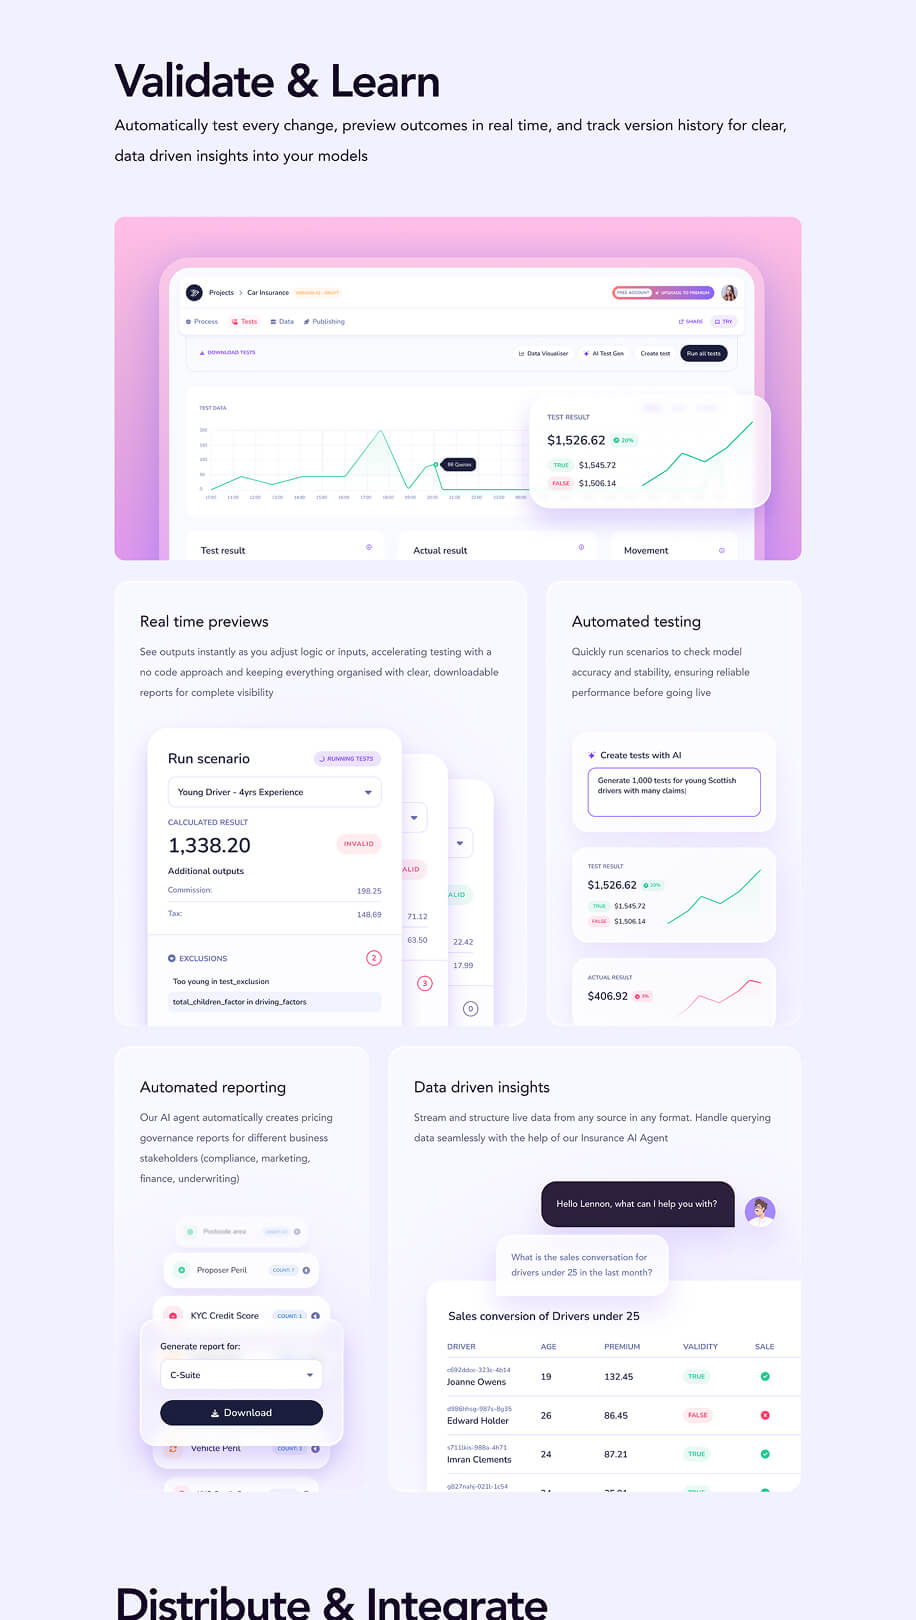
Website homepage for Swallow showing pricing infrastructure for insurers with AI-powered financial pricing models, featuring a purple gradient background and a model-building interface with options to build and test models, including a test scenario for young drivers with experience shown.User interface for validating and learning with AI-driven tools featuring real-time test result previews, automated testing scenarios, AI test generation, automated reporting with downloadable pricing governance reports, and data-driven insights showing sales conversions for drivers under 25 with details on age, premium, and sale validity.Screenshot of a software interface for building and controlling models with natural language or visual tools, featuring sections for creating risk inputs, setting exclusion rules, full visibility of assumptions and output, drag-and-drop logic builder, and real-time collaboration with user roles and permissions.

A full pricing platform, designed end to end

Swallow needed to turn complicated insurance logic into something pricing teams could work with directly. I designed the core experience around how those teams actually work, mapping journeys, shaping workflows and defining how features connected across the product. That meant turning technical processes into clear, familiar experiences that take users from building logic through to testing and deployment without needing to think like developers.

450+
Screens and states
10
Product areas
~70
Features designed
Area
FEATURES_DESIGNED
01
Build
Pricing model builder, model inputs & exclusions, transforms & rating factors, CSV data import, calculations, excesses & endorsements, API integrations, large dataset management, collections & outputs, AI-assisted model building, custom code steps, batch processing, Excel & LLM steps, model grouping, exports, in-product video help
02
Projects
Project management, project workspace, project creation flow, Explain Model reports
03
Process
Process management, AI version summaries, team & task management, asset management, collaboration & comments, version history
04
Test
Model testing, test details & results, AI-generated tests, test visualiser
05
DATA & ANALYTICS
Project analytics, global analytics, data drill-downs, data editing, JSON viewer, data visualisation, sales visualisation
06
Onboarding & Auth
Account creation, authentication, first-time user experience, profile setup, AWS account connection
07
SETTINGS & BILLING
Personal settings, company settings, notification preferences, team management, API key management, billing & payments, audit logs, invitations, integrations, upgrade flows
08
GLOBAL
Design system, global search, search results, error & system states, roles & permissions, AI pricing assistant, upgrade prompts
09
Emails
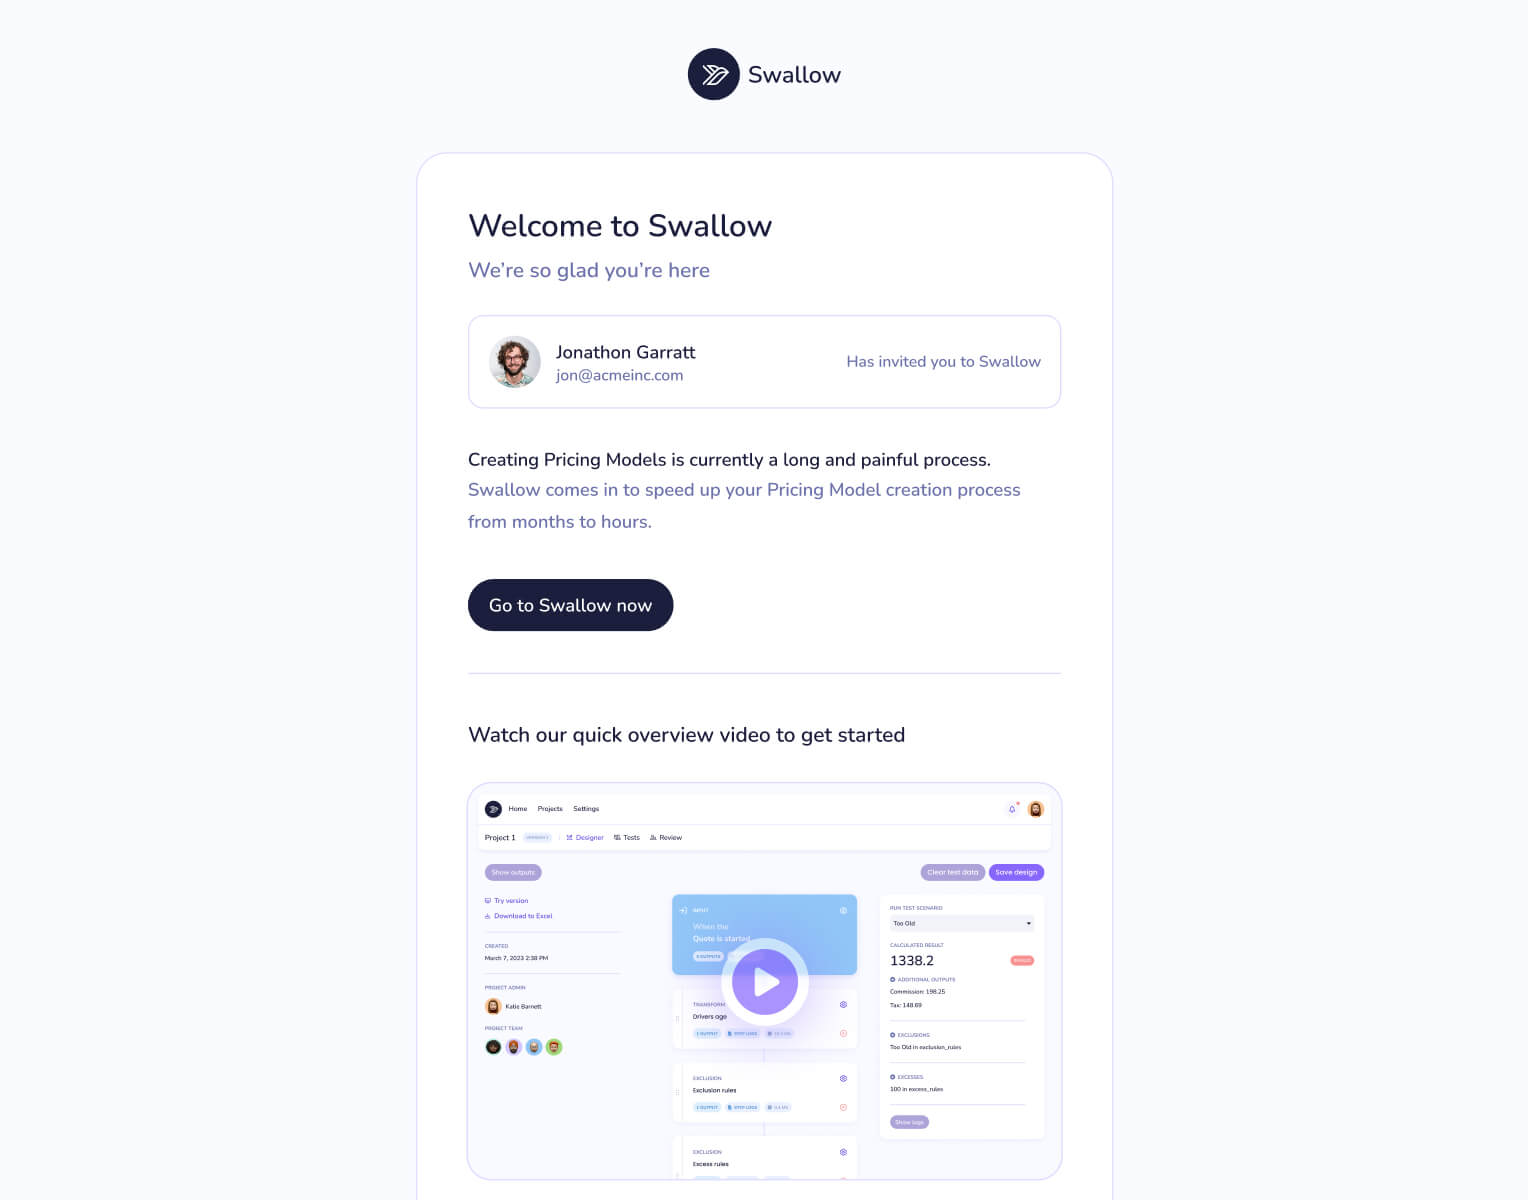
Authentication & welcome emails, project updates, summaries & quotes, mentions, newsletters, billing emails, status updates, export notifications
10
PUBLIC TRY FORM
White-label pricing form, live brand theming
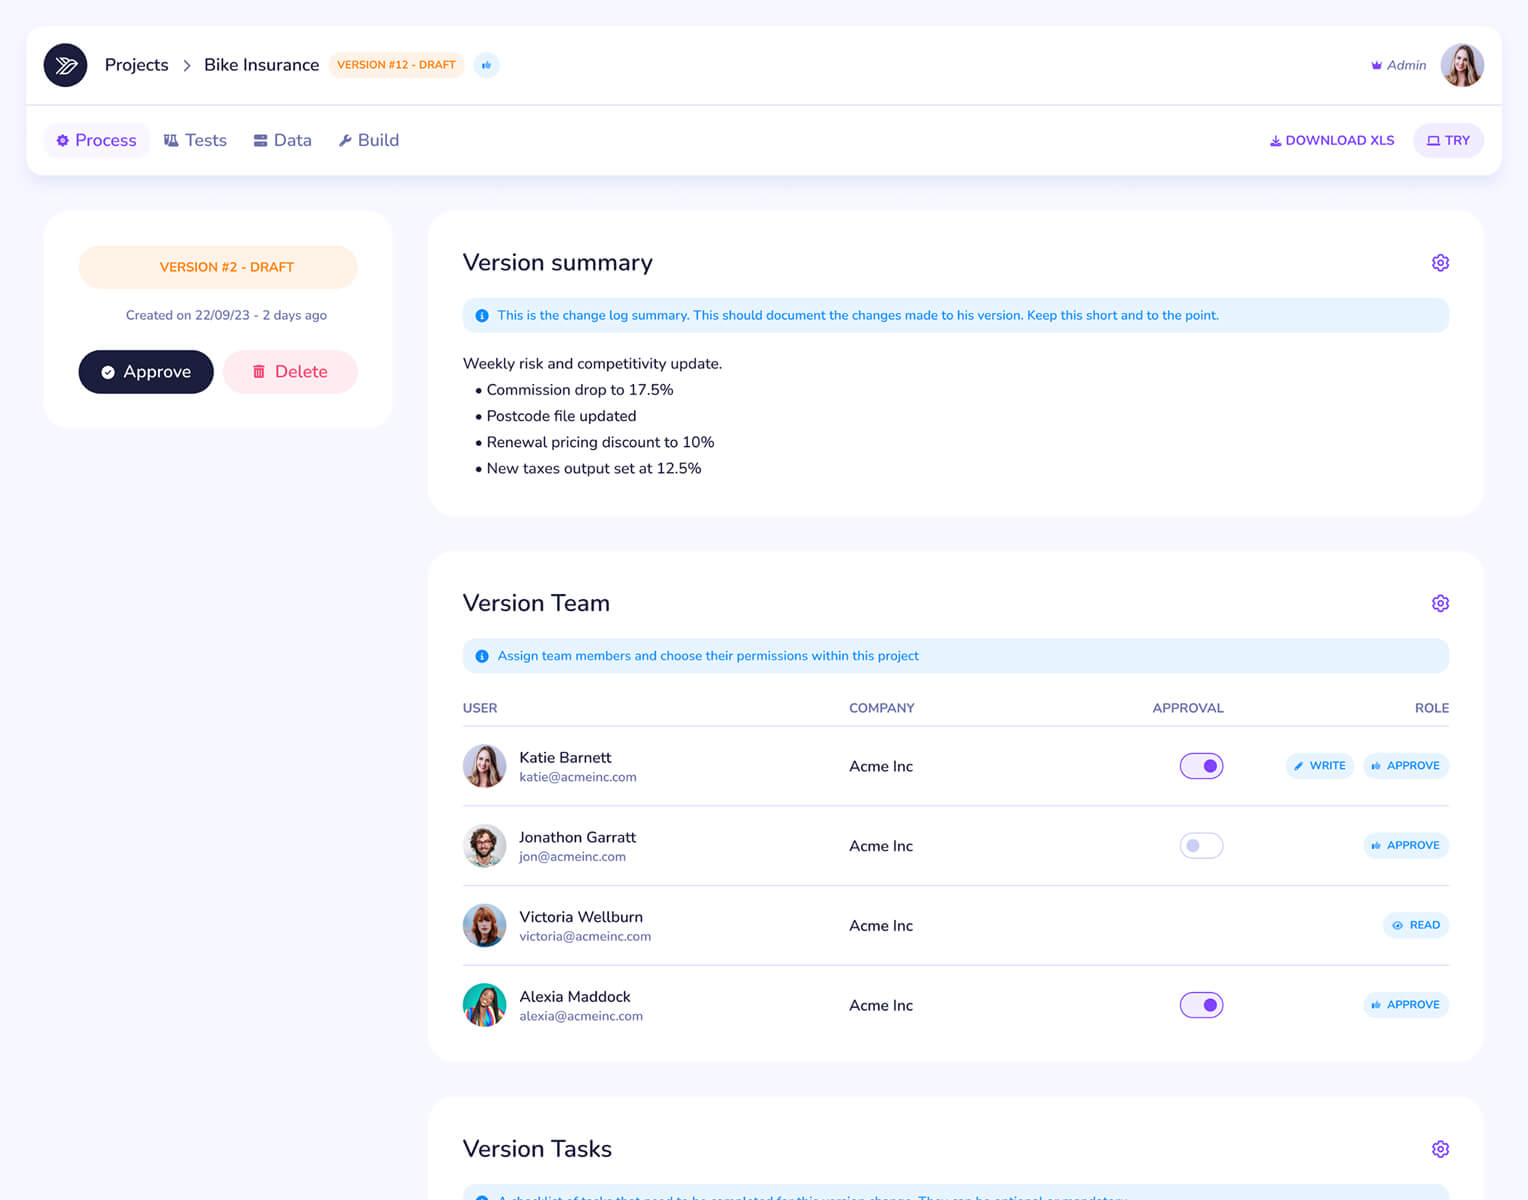
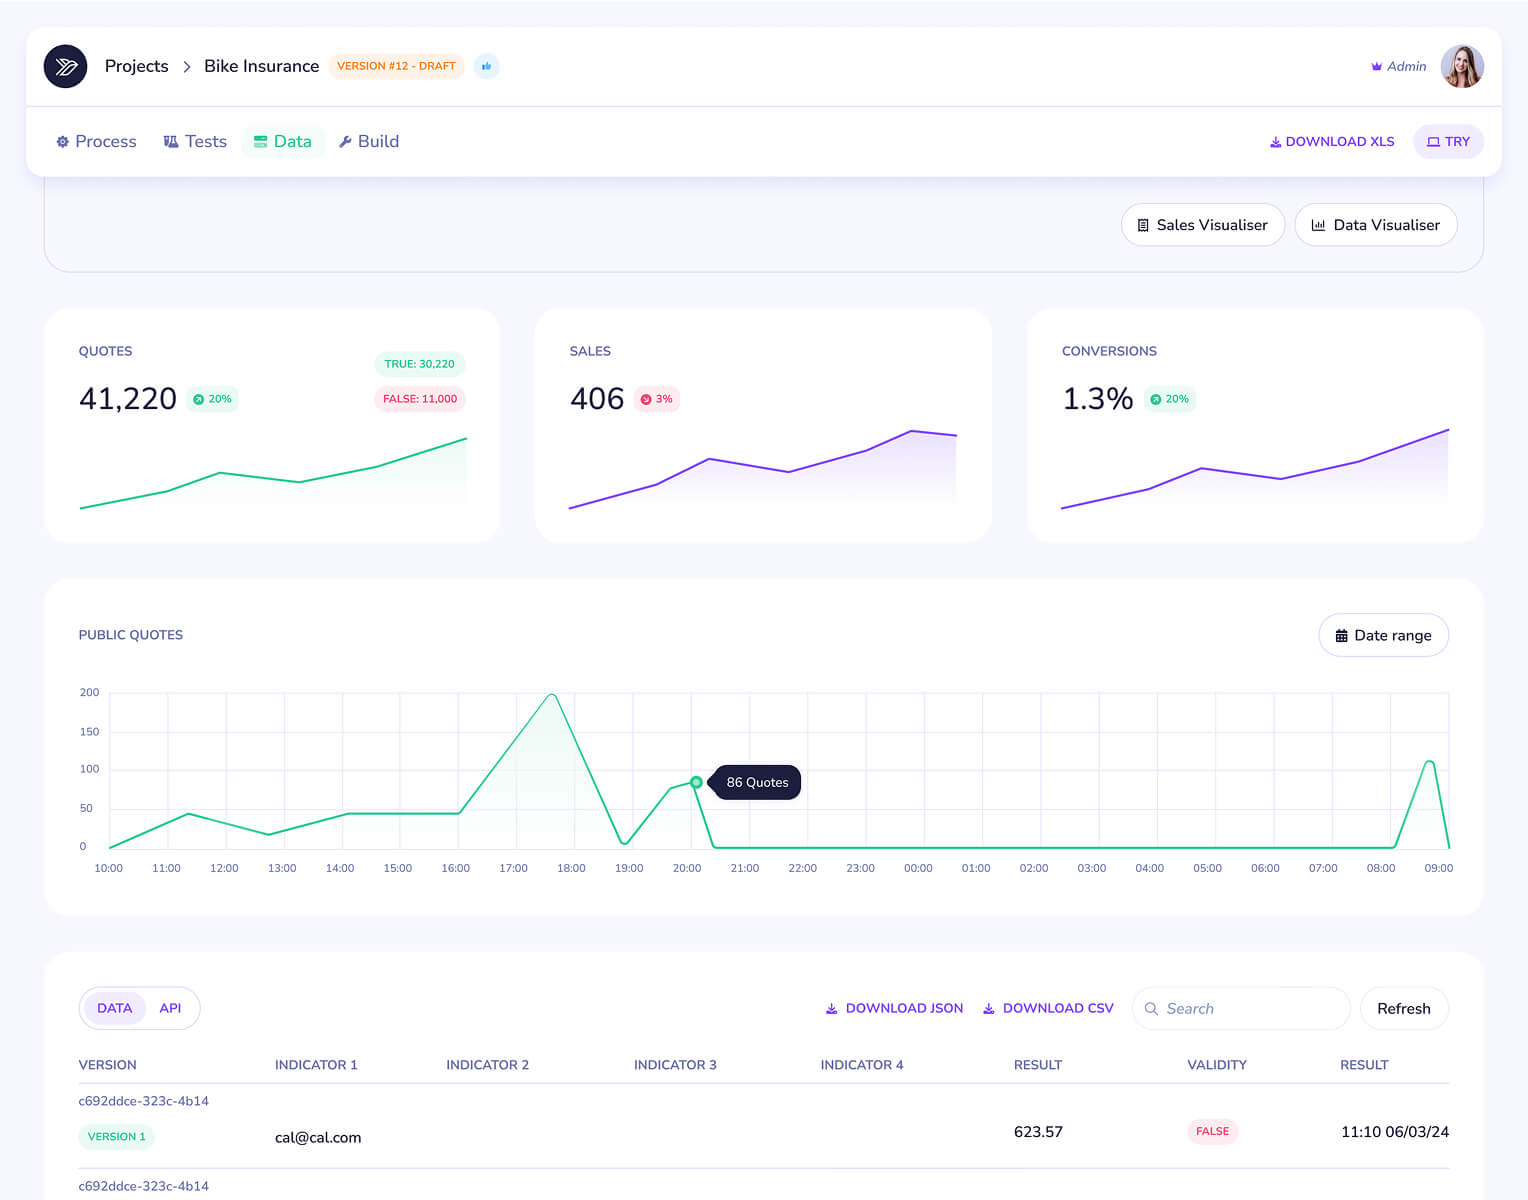
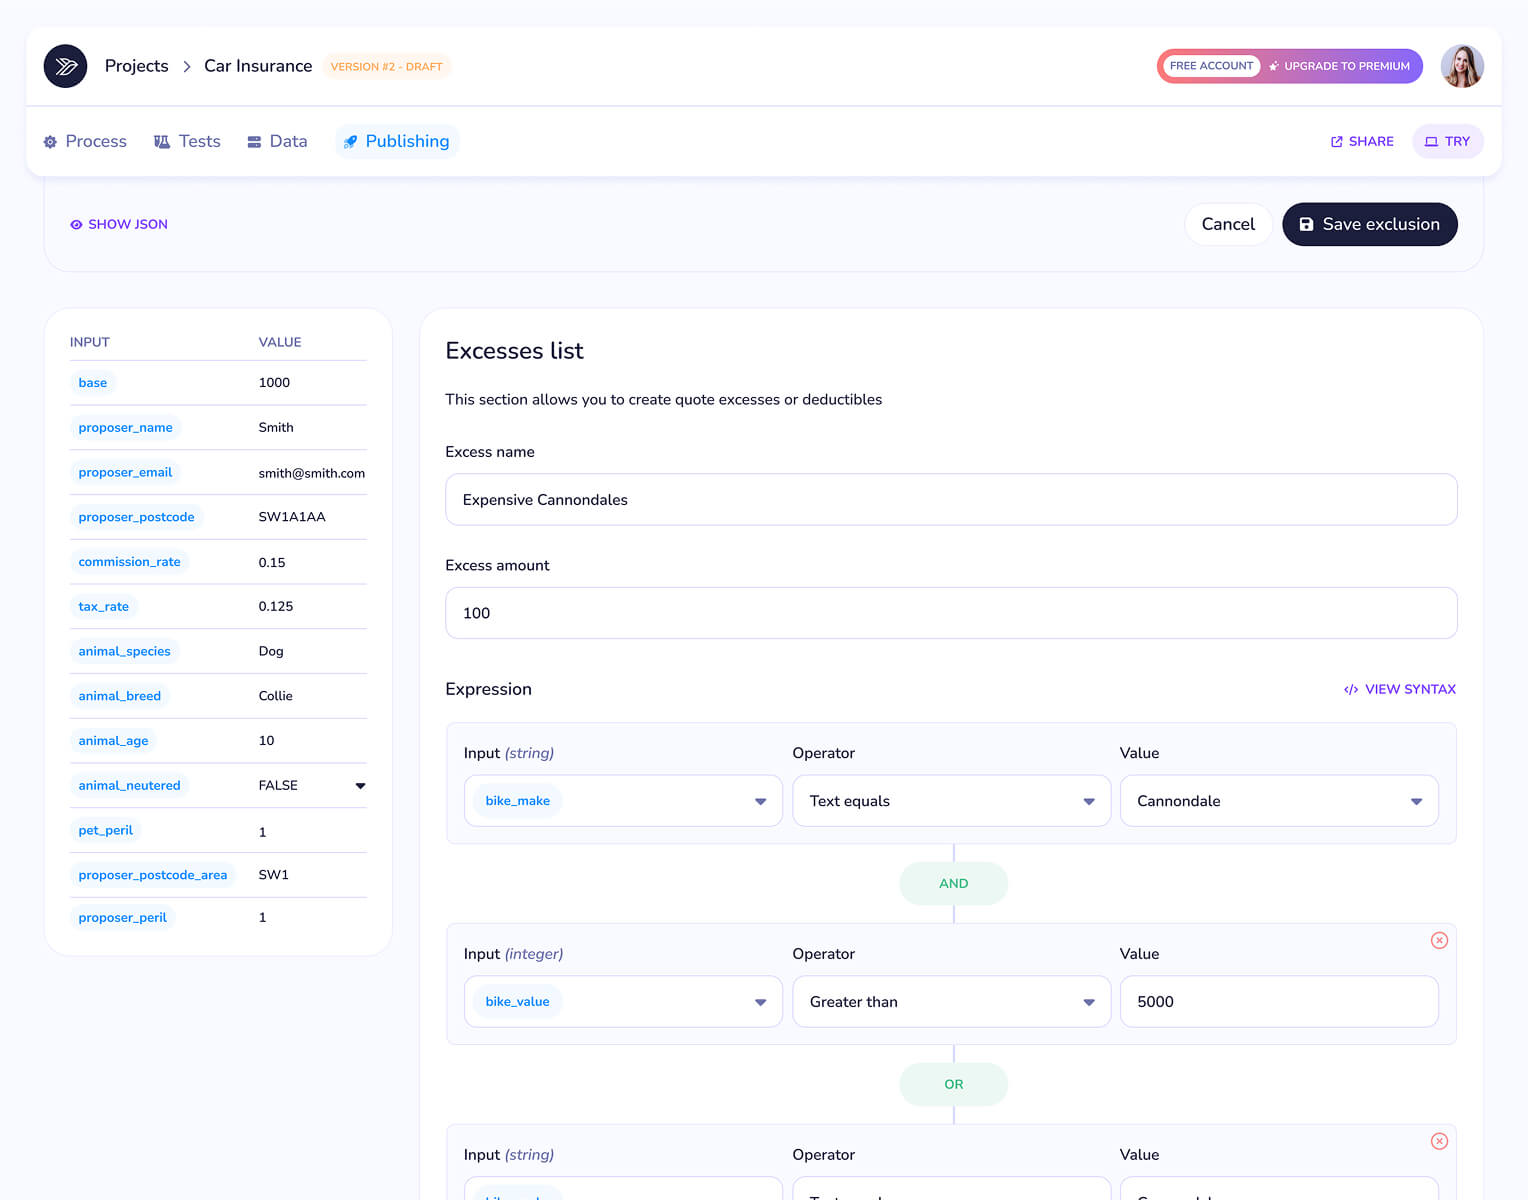
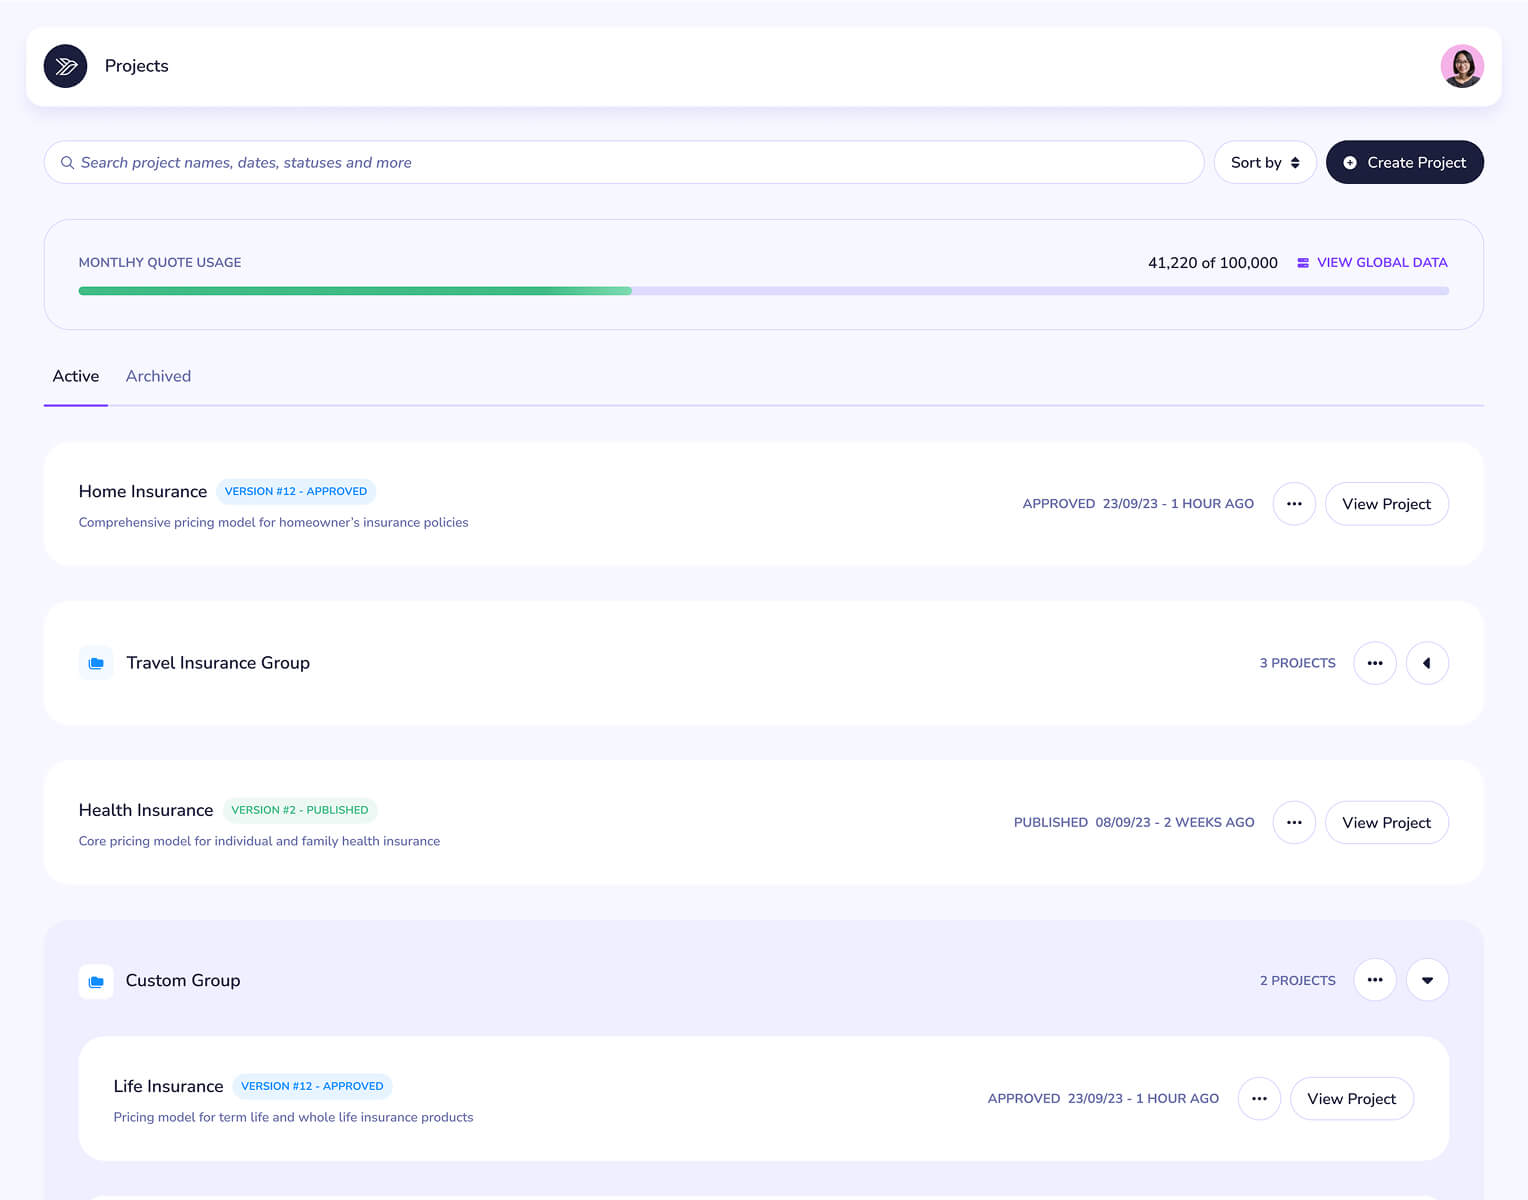
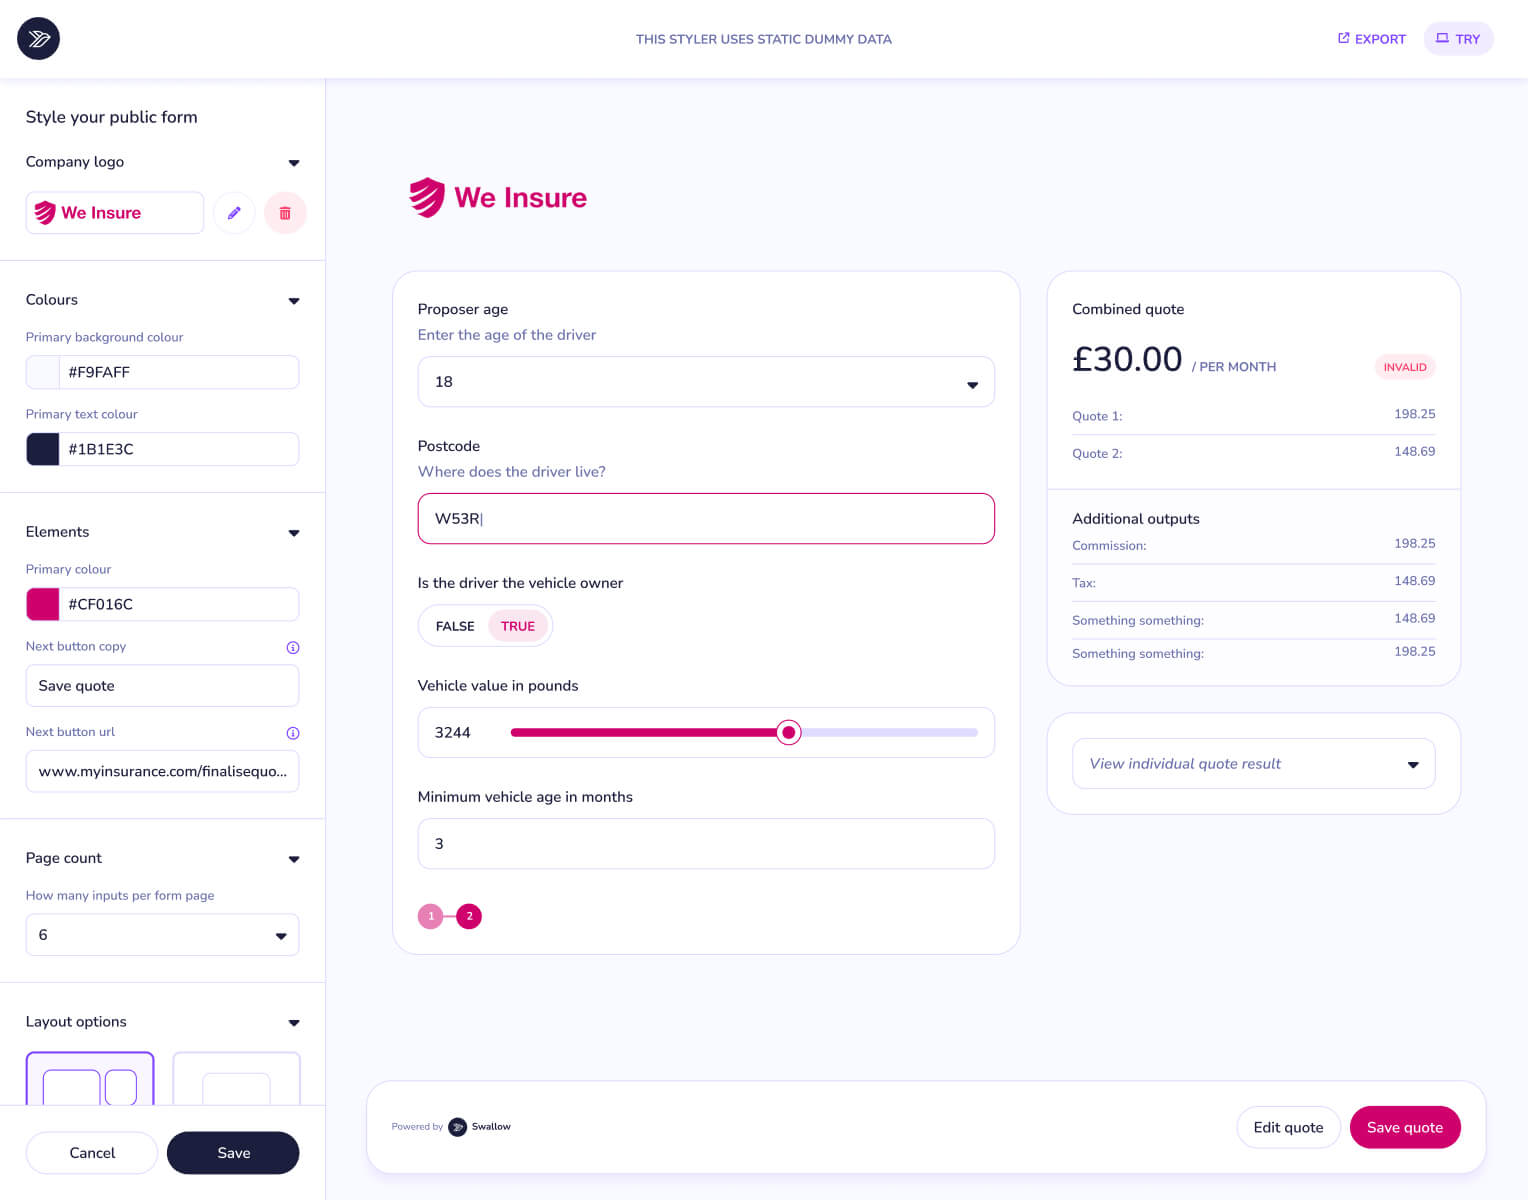
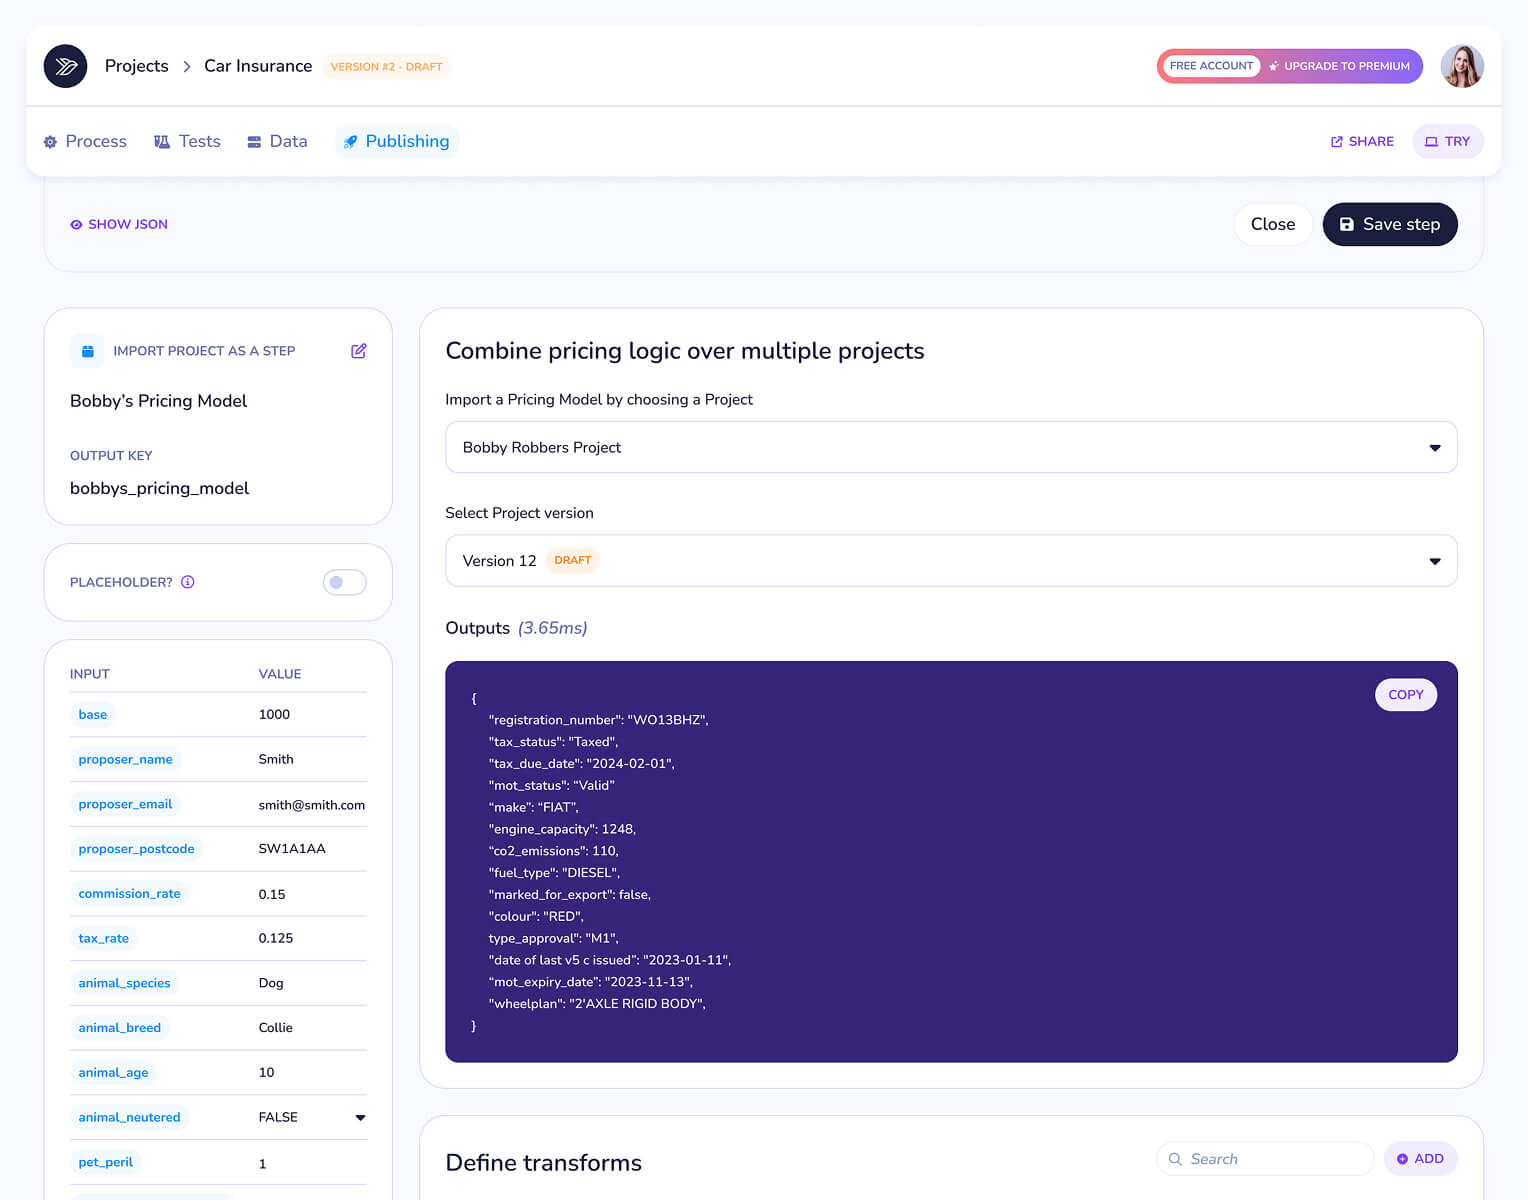
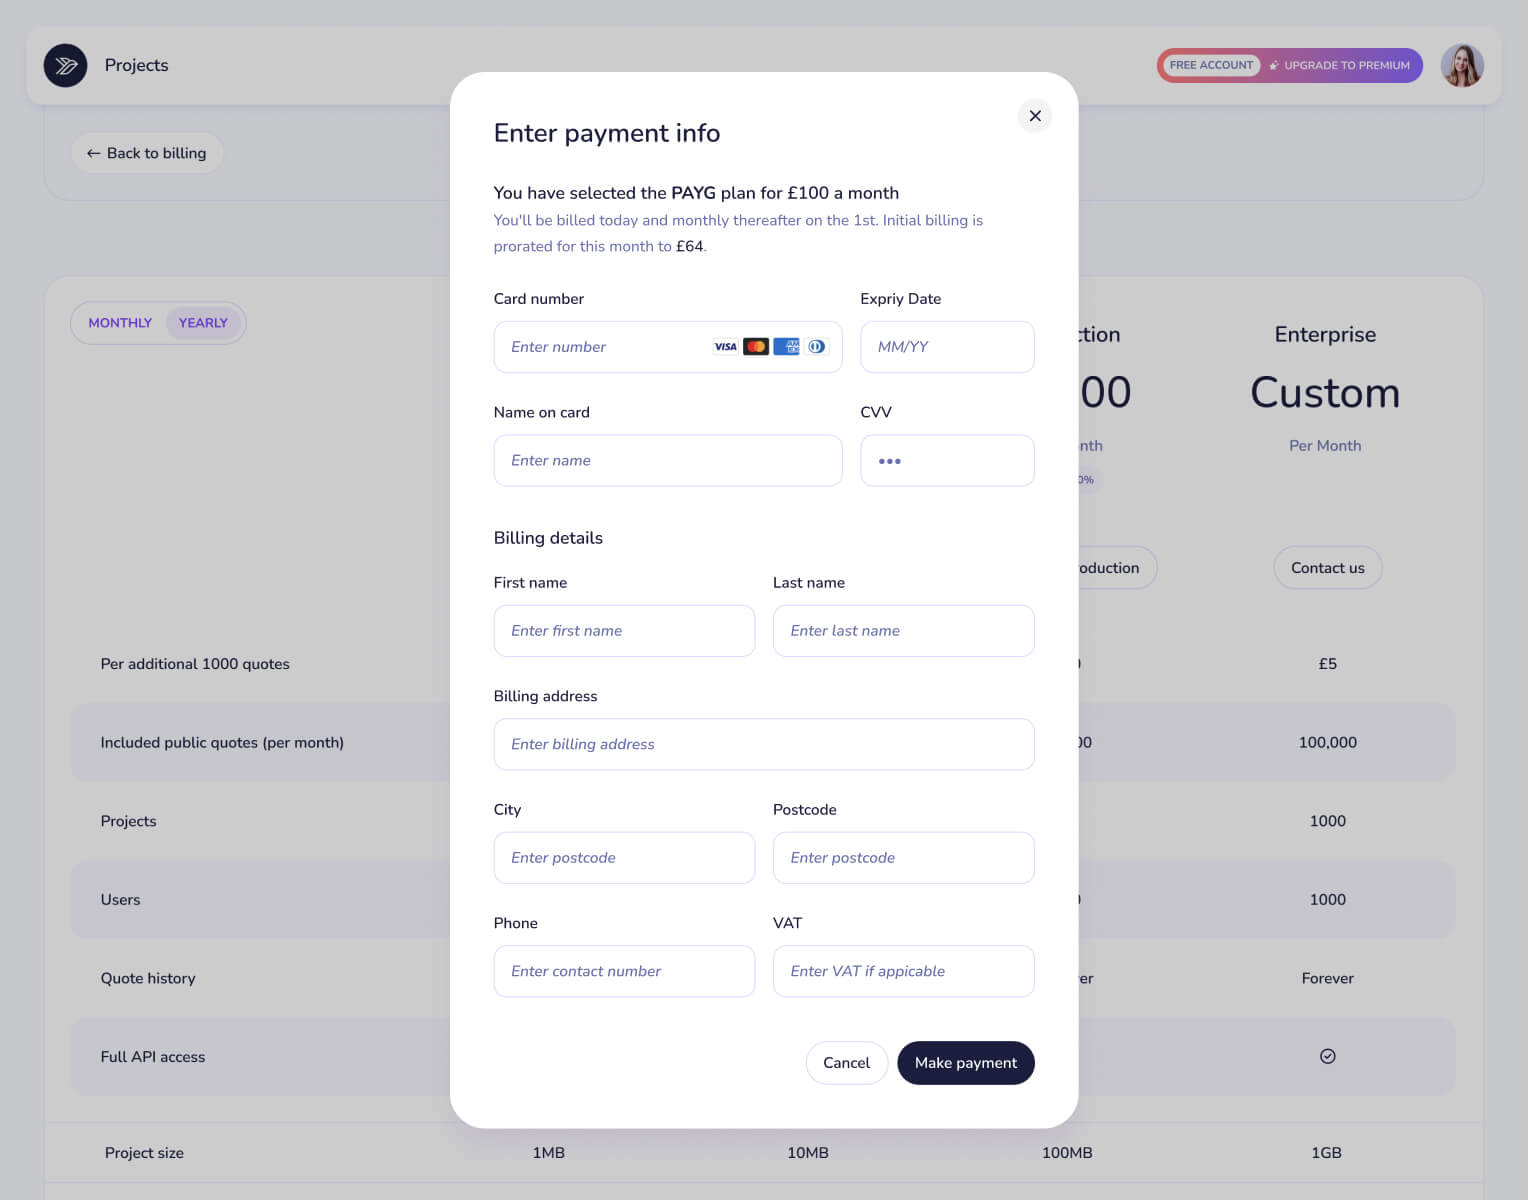
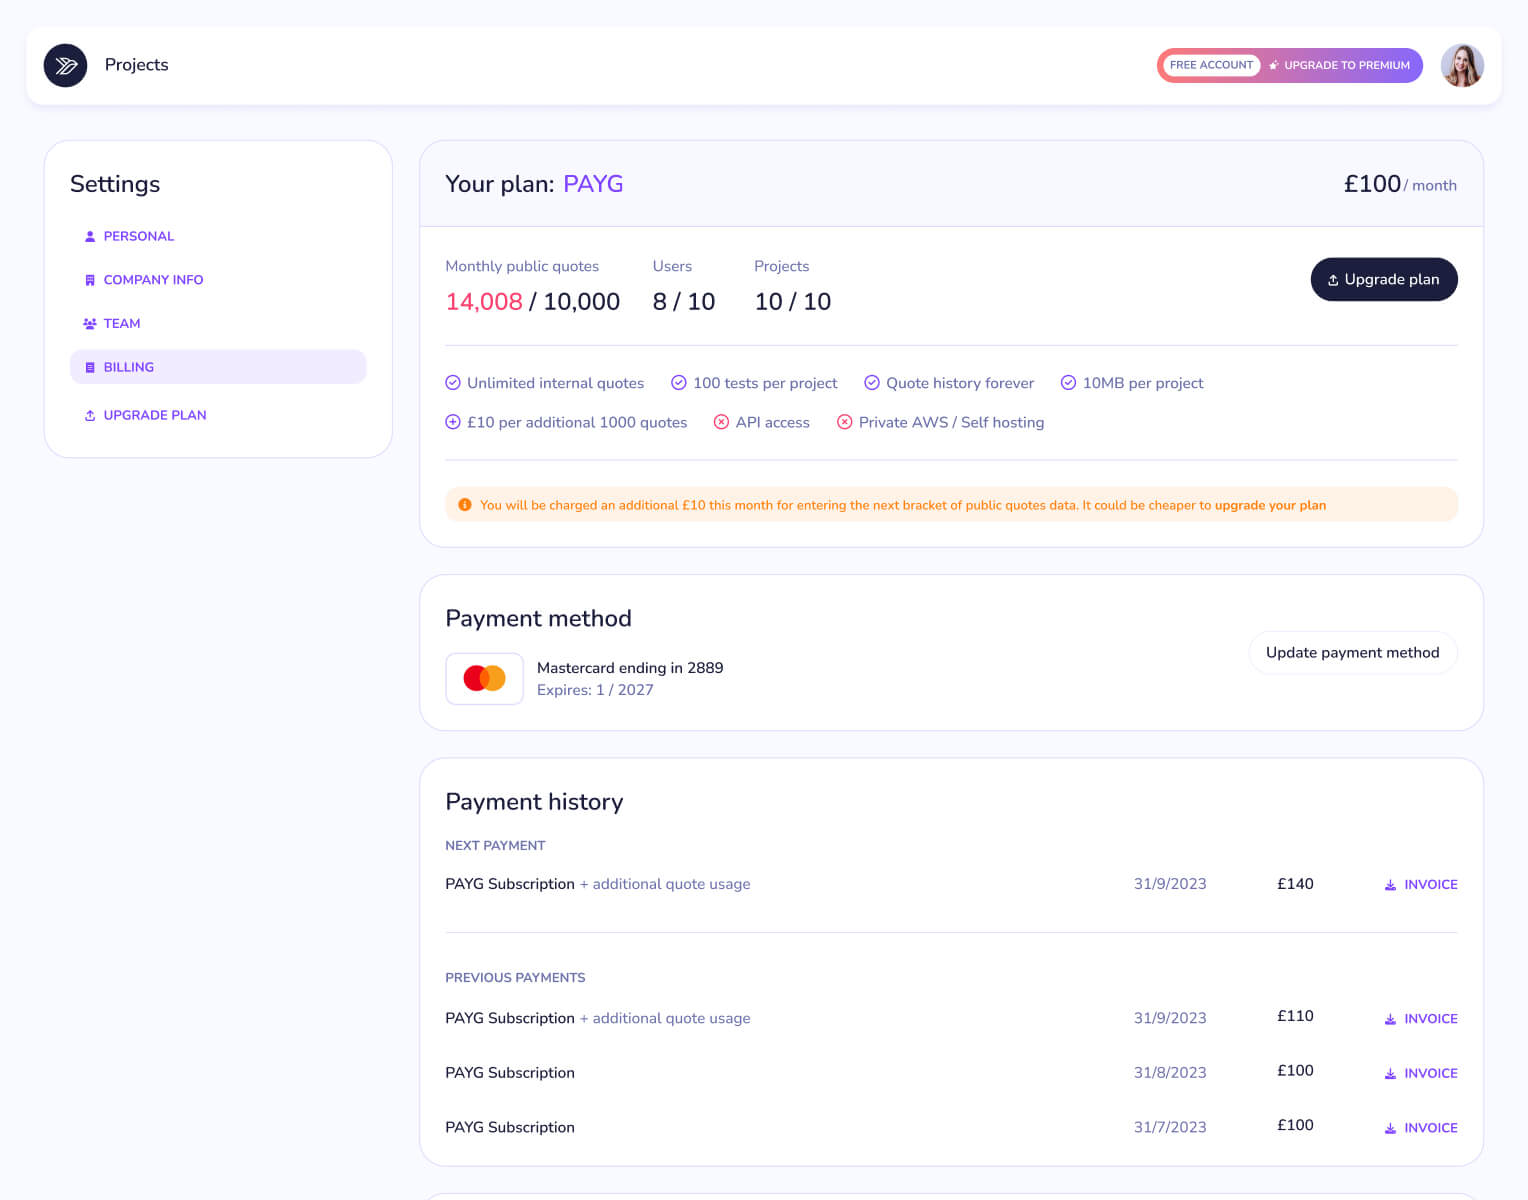
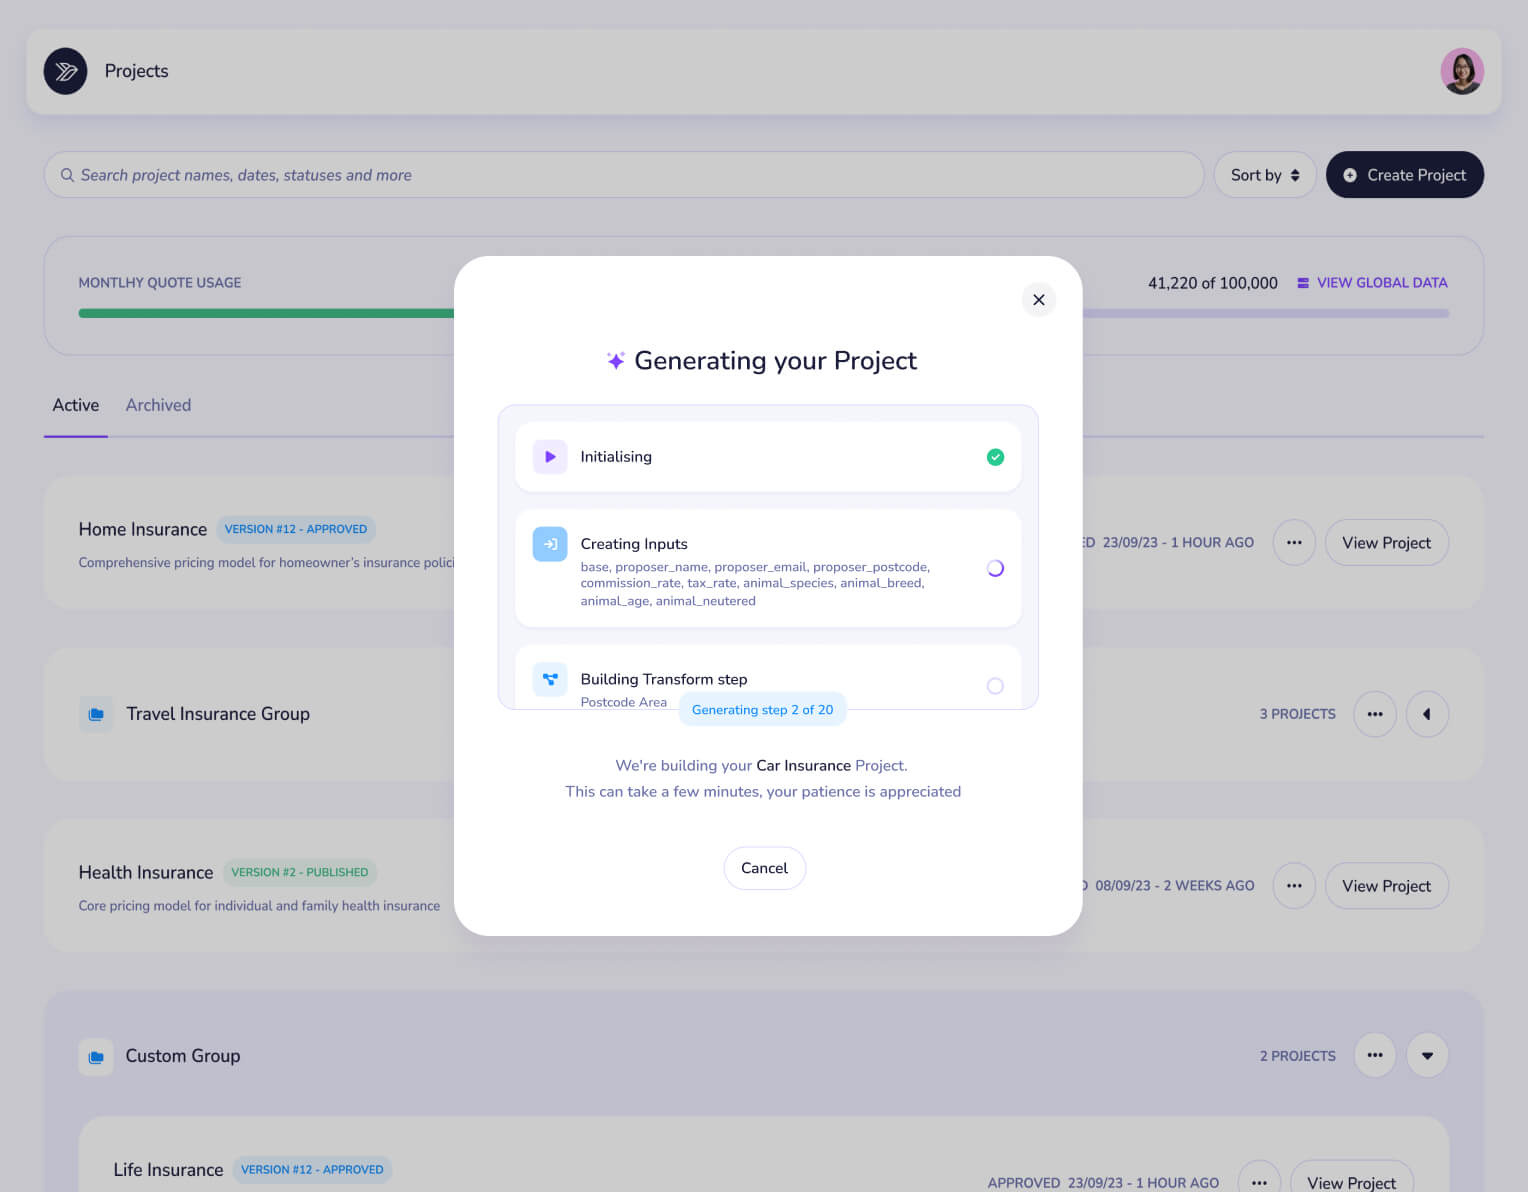
Project management dashboard interface for 'Bike Insurance' showing version details, including version #2 draft created 2 days ago with Approve and Delete buttons, a version summary listing weekly risk updates such as commission drop to 17.5%, postcode file update, renewal pricing discount to 10%, and new taxes output at 12.5%. The Version Team section lists four team members from Acme Inc with their emails, approval toggles, and roles like write, approve, and read permissions. Navigation tabs for Process, Tests, Data, and Build, with options to download XLS or try the project.User interface screen showing a Define property dialog for 'Proposer Postcode' with fields for property name, key, data type set to String, default value 'SW1A 11A', and other values including dog breeds Labrador, Poodle, with cursor typing 'Golden Retri'. Indicator toggle is on, Static toggle is off. Background lists inputs named Animal Neutered with keys and default boolean values. Buttons visible include Save step, Close, Cancel, and Save.User interface of a car insurance project in a modeling tool showing a build workflow with input trigger 'When the Quote is started,' driver rules, high-risk exclusions, and total calculated premium steps, with a test scenario panel displaying calculated result of 1338.2 for 'Young Driver - 4yrs Experience,' including commission and tax, plus exclusions and excesses with options to download or view logs.Dashboard for Bike Insurance project showing summary metrics and charts: Quotes at 41,220 with 20% increase, Sales at 406 with 3% decrease, Conversions at 1.3% with 20% increase. Line graphs visualize trends for quotes, sales, and conversions. Public Quotes line chart with peaks at 17:00 and 09:00 hours, with 86 quotes at 20:00. Data table lists version, email indicator, numeric results, validity status marked false, and timestamps. Navigation includes Process, Tests, Data (selected), Build, and options to download XLS, JSON, CSV, or try the tool.User interface screen showing a 'Car Insurance' project in draft version with tabs for Process, Tests, Data, and Publishing. The Publishing tab displays an Excesses list form with fields to create quote excesses or deductibles, including Excess name set to 'Expensive Cannondales' and Excess amount of 100. Below, an expression builder has rules: bike_make text equals Cannondale AND bike_value greater than 5000. On the left, input values include base 1000, proposer name Smith, email, postcode, commission rate, tax rate, and pet and animal information. Buttons for Cancel and Save exclusion are visible at the top right.Website sign-up page split into two sections: left dark blue section with Swallow logo, headline 'Launch Your Pricing Models Faster,' subtext about simplifying pricing and automating testing, and a testimonial quote from Will Clarkson Webb, Founder & CEO of Rivr. Right light background section features a sign-up form with fields for email, first and last name, company name, invite code, a checkbox agreeing to terms, and a 'Create account' button.Dashboard screen displaying projects with a search bar, sort option, and a button to create a project; shows monthly quote usage bar with 41,220 of 100,000 used. Lists active projects: Home Insurance (version 12 approved, updated 1 hour ago), Travel Insurance Group with 3 projects, Health Insurance (version 2 published, updated 2 weeks ago), and Custom Group containing Life Insurance (version 12 approved, updated 1 hour ago). Each project has a description, status, update time, and button to view the project.Interface of a project named Car Insurance showing input data on the left with values like base 1000, proposer name Smith, email, postcode, commission and tax rates, and animal details including species Dog and breed Collie. The main panel shows a Factors list section describing factors as mapped data tables, with a factor name 'Animal breeds dog factors.' Below, a table lists factor items with columns for input, value, and value mappings featuring various dog breeds such as Golden Retriever, Labrador Retriever, Border Collie, and Cocker Spaniel repeated under multiple columns. Options to download or upload CSV files and buttons to share, try, cancel, or save the factor are visible.Insurance form interface for We Insure with fields for driver age set to 18, postcode partially entered as W53R, vehicle owner set to true, vehicle value at 3244 pounds with a slider, and minimum vehicle age of 3 months. The combined quote is £30.00 per month marked invalid, with detailed pricing and additional outputs shown. Style options on the left allow customization of company logo, colors, button text, page count, and layout. Buttons at bottom to cancel, save, or edit quote.User interface of a project dashboard named Car Insurance displaying test analysis. The top chart shows a line graph of public quotes pivoted on input 'age_of_driver' with time on the horizontal axis and premium on the vertical axis, highlighting 86 quotes at 20:00. The bottom chart is a stacked bar graph labeled Test Data with count on the vertical axis and quotability on the horizontal axis, showing green and red segments with a data point labeled 'Data info'. Navigation menus include Process, Tests, Data, Publishing, and user account options.Welcome screen for Swallow software showing an invitation from Jonathon Garratt (jon@acmeinc.com), a short message about speeding up pricing model creation, a button labeled 'Go to Swallow now,' and a preview of an overview video with a play button over a dashboard interface.User interface of an insurance project named Car Insurance, version 12 draft, showing a build workflow with steps: Input when Quote is started, driver rules, high risk exclusions, and total calculated premium. A panel displays a test scenario for a young driver with 4 years experience and a calculated result of 1338.2. Additional outputs include commission and tax. A chat window on the right shows interaction where a user asks for a Swallow pricing model using attached Risk Model.csv and Model_rules.pdf files, and the response confirms the pricing model has been updated. Options to download and upload model files are visible.User interface screen of a project named Car Insurance, showing a section to combine pricing logic over multiple projects. The interface includes fields to import a pricing model as a step with output key 'bobbys_pricing_model', and input values such as base 1000, proposer name Smith, email smith@smith.com, postcode SW1A1AA, commission rate 0.15, tax rate 0.125, and animal details (species Dog, breed Collie, age 10, neutered false). A dropdown to select 'Bobby Robbers Project' and version 12 (draft) is visible, with a code block showing JSON output related to a vehicle registration, tax, MOT status, vehicle make FIAT, engine capacity 1248, CO2 emissions 110, fuel type DIESEL, color RED, and wheelplan '2AXLE RIGID BODY'. Buttons 'Save step' and 'Close' appear at the top right. Navigation tabs include Process, Tests, Data, Publishing.Online payment form overlay showing selection of PAYG plan for £100 monthly with proration to £64 for the initial month; fields for card number, expiry date, name, CVV, billing first and last name, billing address, city, postcode, phone, VAT; buttons labeled Cancel and Make payment.User account dashboard showing PAYG billing plan details with monthly public quotes 14,008 of 10,000 limit, 8 of 10 users, 10 of 10 projects, and a monthly cost of £100. Features include unlimited internal quotes, 100 tests per project, quote history forever, 10MB per project, £10 per additional 1000 quotes, but no API access or private AWS/self-hosting. Warning about additional £10 charge for exceeding quote bracket, with suggestion to upgrade plan. Payment method listed as Mastercard ending in 2889 expiring 1/2027 with an option to update. Payment history displays past PAYG subscription payments on 31/7/2023, 31/8/2023, and 31/9/2023 with amounts and invoice download links. Navigation menu includes Personal, Company Info, Team, Billing, Upgrade Plan options on the left side.User interface showing a project management dashboard with a 'Generating your Project' popup in the center outlining steps: Initialising, Creating Inputs with data fields, and Building Transform step with progress 'Generating step 2 of 20'. The background shows various insurance project groups: Home Insurance, Travel Insurance Group, Health Insurance, and Custom Group with project statuses and options to view projects. Monthly quote usage bar at the top indicating 41,220 of 100,000 used.
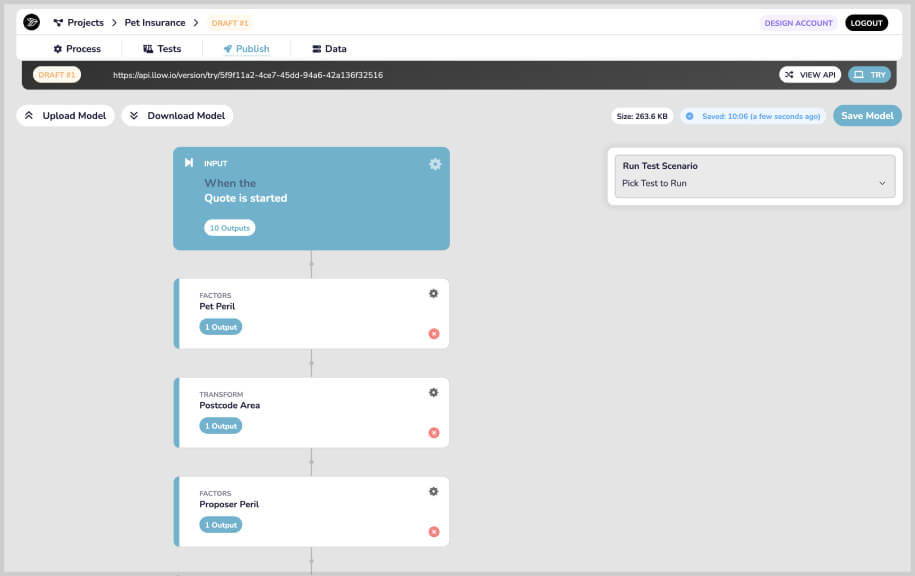
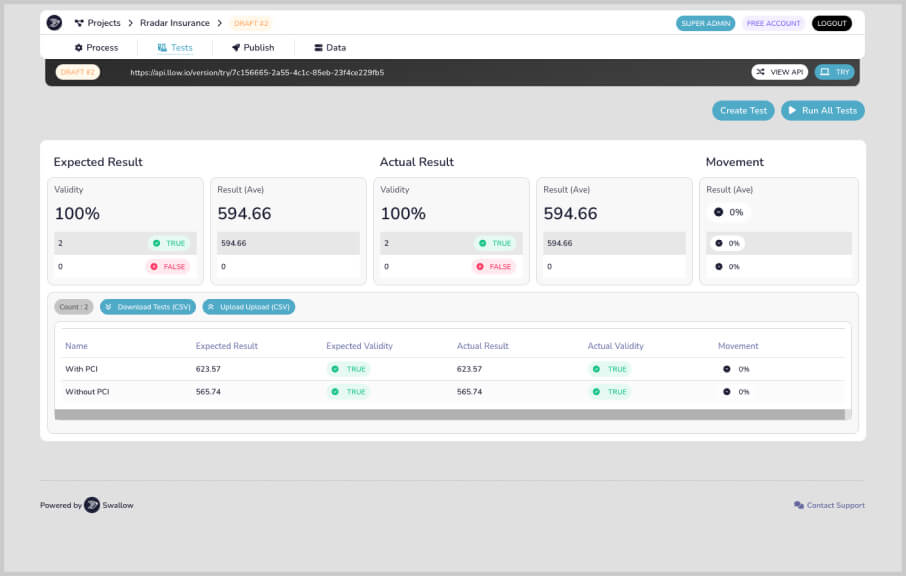
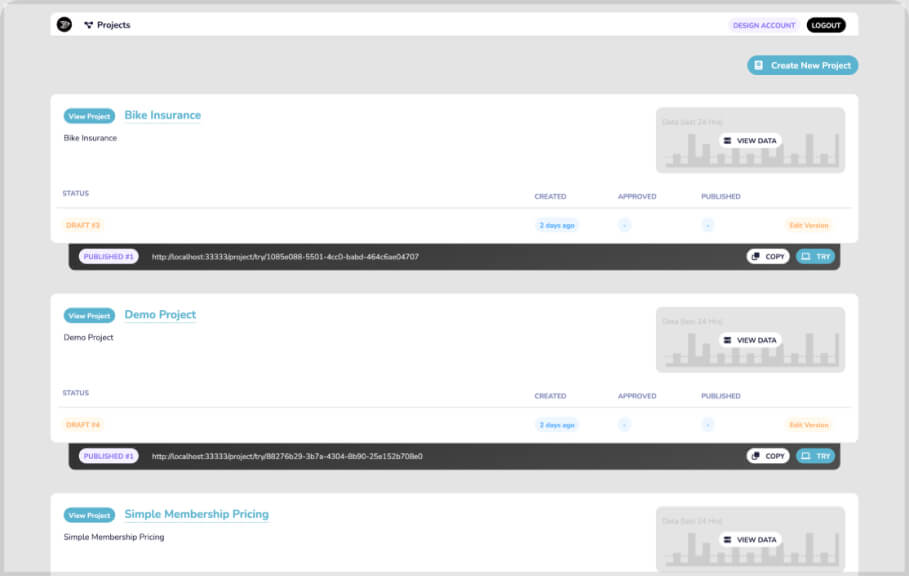
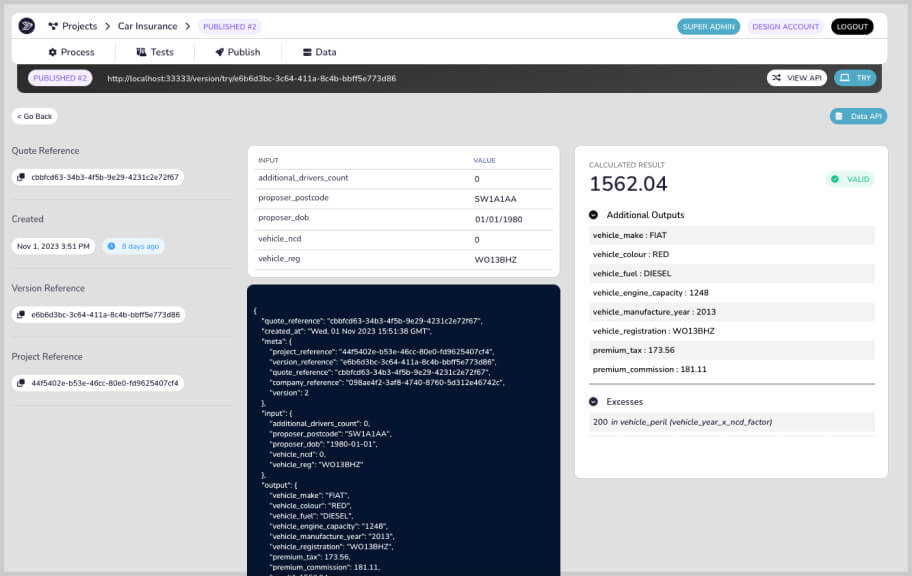
User interface of a project titled 'Pet Insurance' showing a draft model workflow from 'Quote is started' input to factors including 'Pet Peril', 'Postcode Area' transform, and 'Proposer Peril' factors with options to upload/download model, run test scenario, and save model.Web interface showing test results for 'Radarn Insurance' project with tabs for Process, Tests, Publish, and Data. The 'Tests' tab is active displaying a draft test URL and buttons for viewing API, creating tests, and running all tests. The results section compares Expected Result and Actual Result for Validity (both 100%) and Result Average (594.66), plus Movement result at 0%. A table below lists two entries: 'With PCI' and 'Without PCI,' with expected and actual results (623.57 and 565.74 respectively), all marked as true validity and 0% movement. The interface includes options to download or upload tests as CSV files and shows administrative login status.Web interface showing three project cards titled 'Bike Insurance', 'Demo Project', and 'Simple Membership Pricing', each with buttons to view project, status as draft, created date, and published data with options to copy URL or try project, plus a graph data preview and options to edit version.Screenshot of a car insurance software interface showing input data and calculated results for a quote. Inputs include additional drivers count as zero, proposer postcode SW1A1AA, date of birth 01/01/1980, no claims discount zero, and vehicle registration WO13BHZ. The JSON output displays vehicle make FIAT, color RED, fuel DIESEL, engine capacity 1248, manufacture year 2013, and registration WO13BHZ. Calculated result shows a premium total of 1562.04 with premium tax of 173.56 and commission 181.11. Excesses include 200 in vehicle peril. The interface shows project, version, quote, and created at references along the left side.
LEGACY_PRODUCT_UI
PRE_REDESIGN
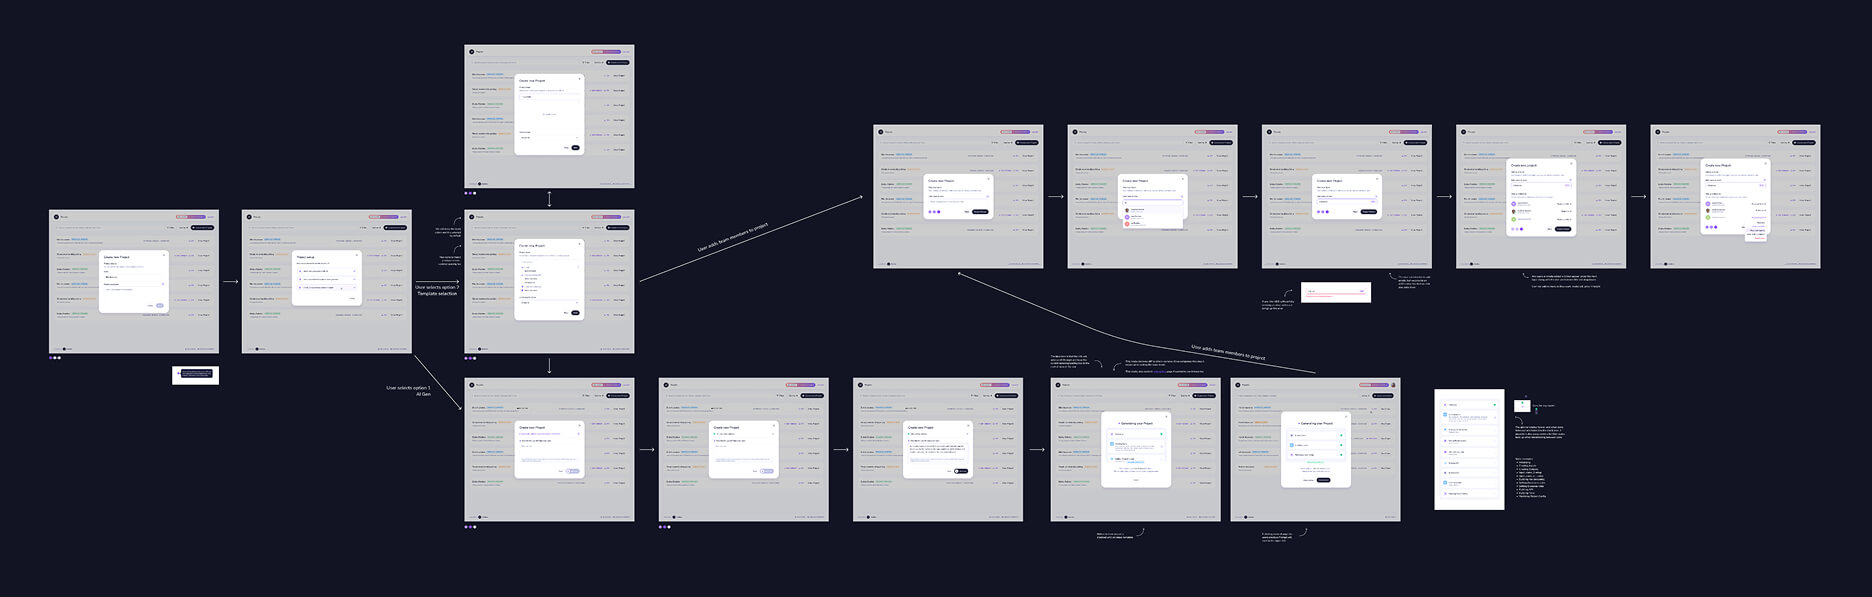
A detailed project creation flowchart showing user interface screens for creating a new project within a software application, including dialog boxes for project title, prompts, template selection, and AI generation options, with arrows and annotations indicating the step-by-step process and user actions for adding team members and generating the project.
Viewport_Projects
AI_Project_Generation_Flow

Beyond the happy path

The finished screens were only part of the work. Each feature was designed across complete flows, states, behaviours, edge cases and responsive layouts.

Detailed specs and annotations documented how everything should work, giving developers clarity from the overall journey down to individual interactions and states.
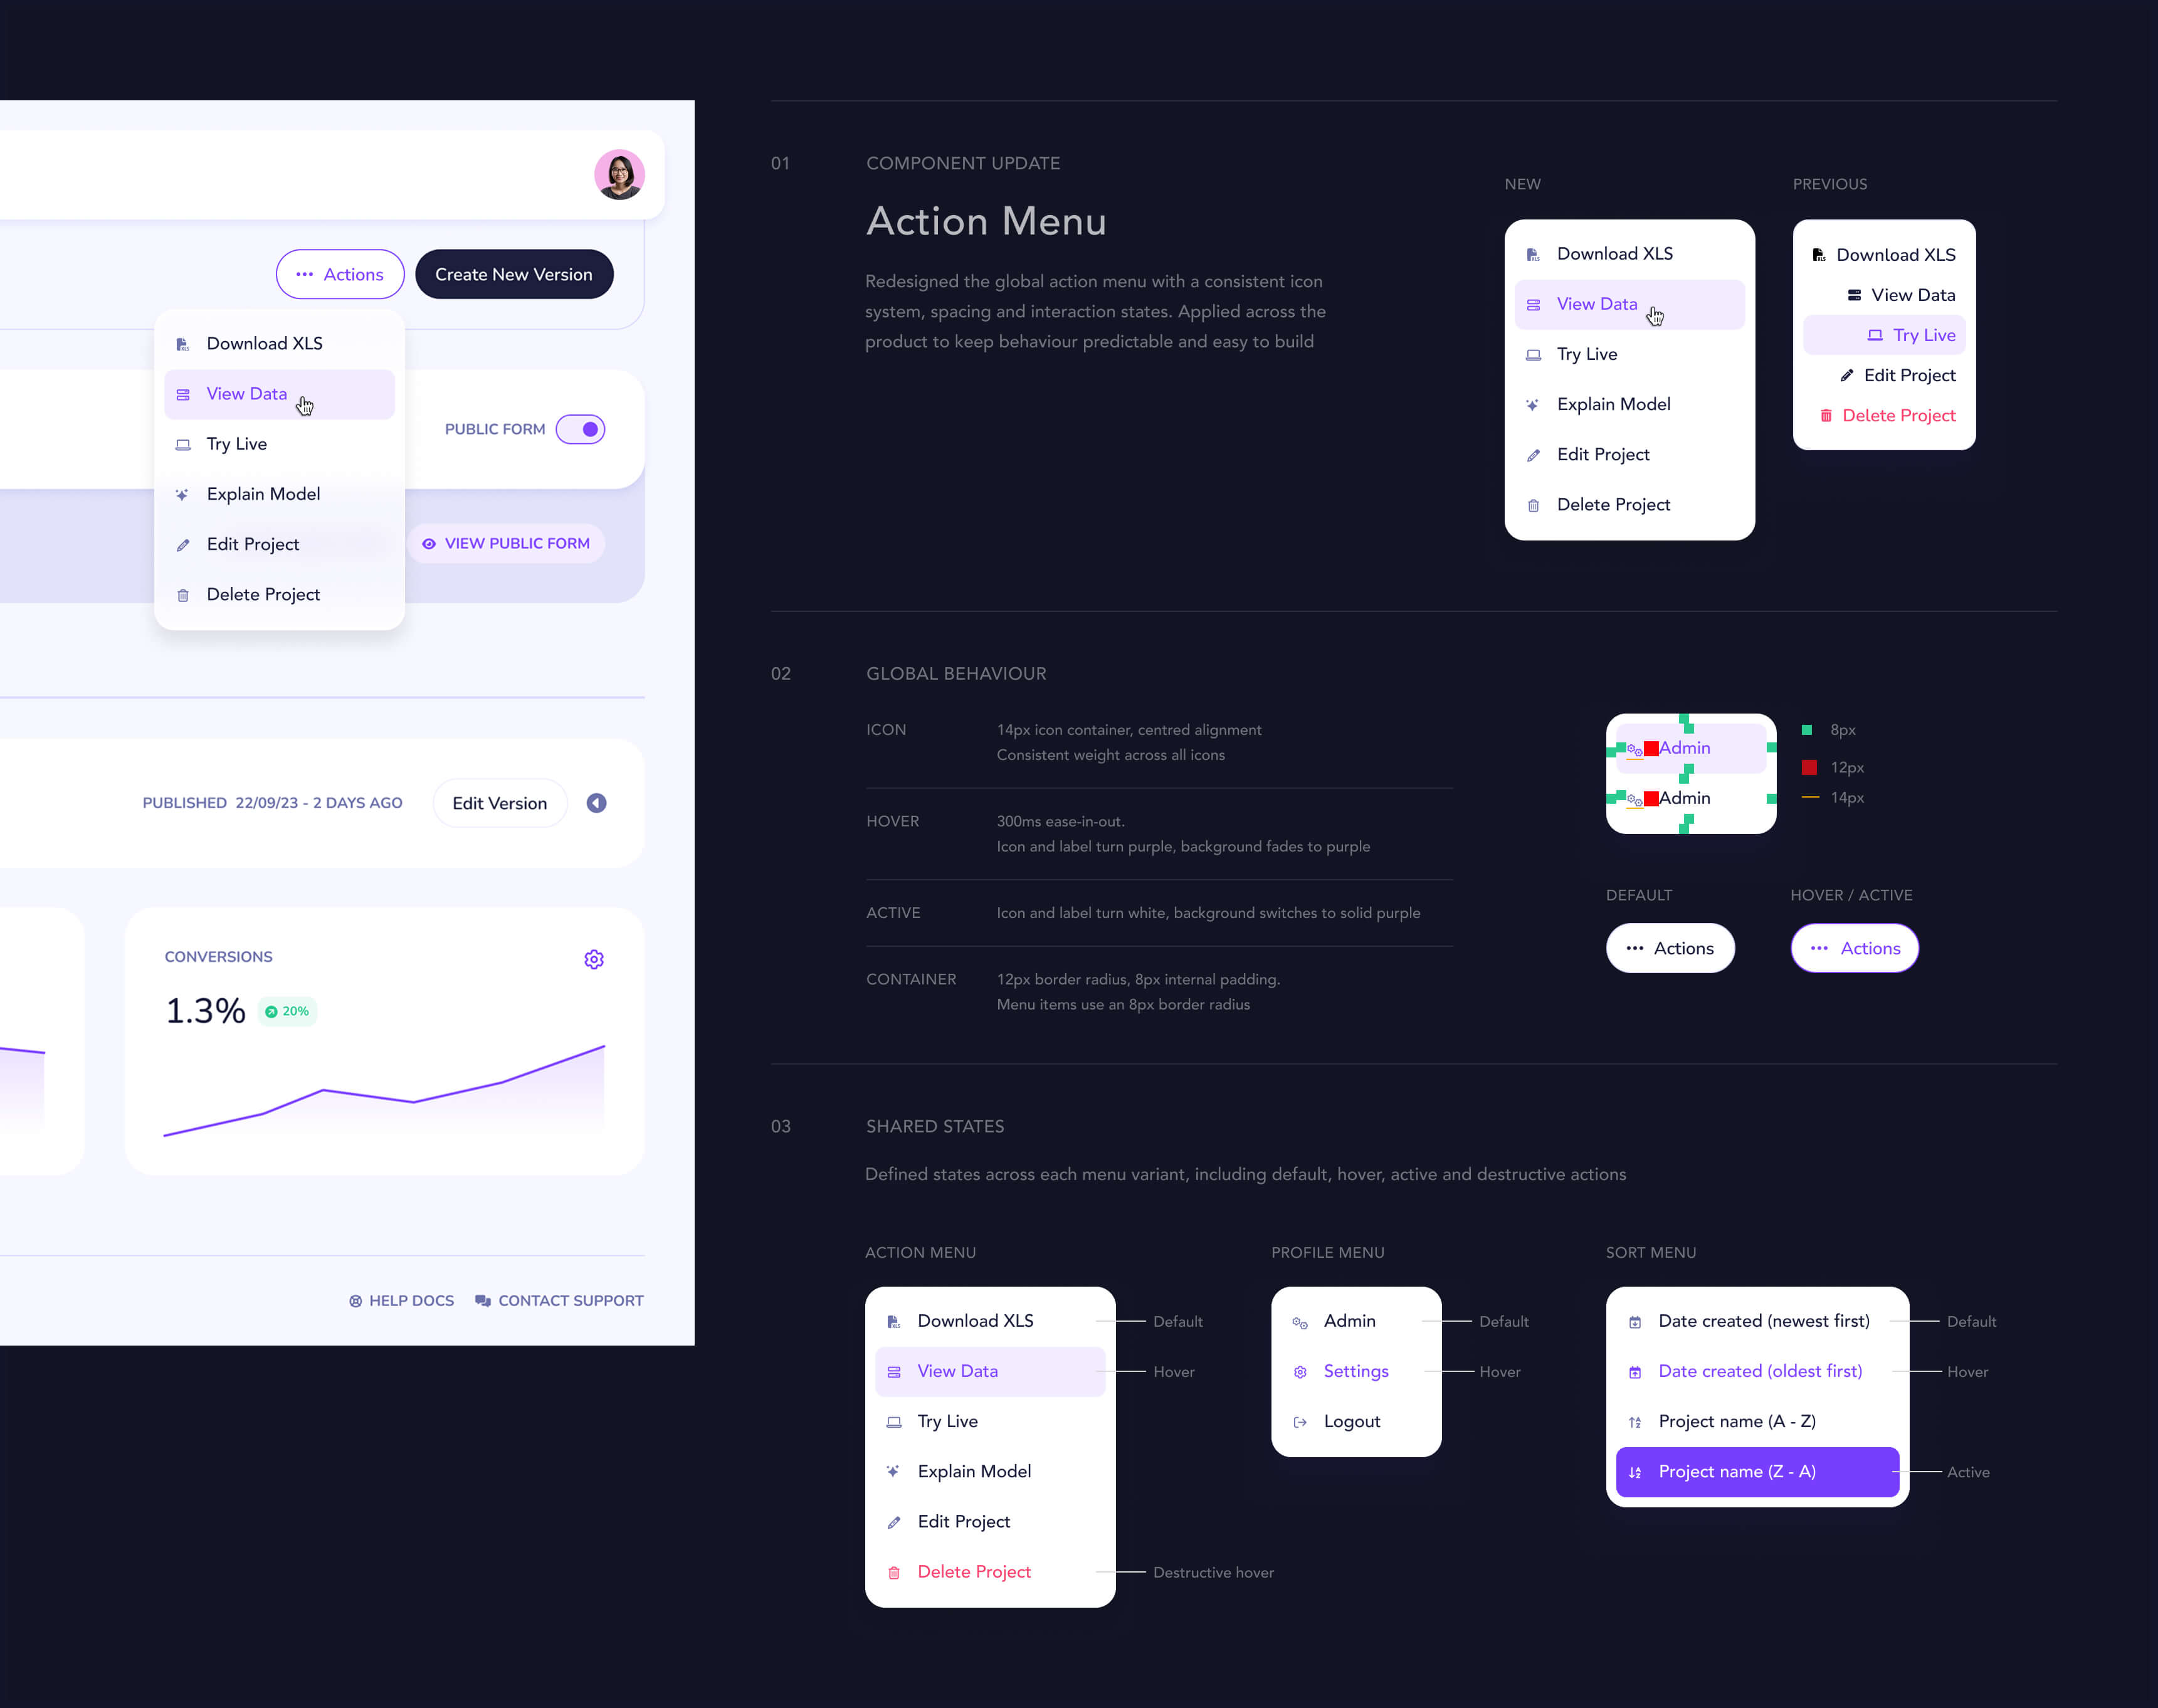
UI design presentation for a redesigned global action menu showing consistent icon system and interaction states with examples of new and previous menus, hover, active states, and shared menu states across action, profile, and sort menus on a dark background.
Viewport_components
Action_Menu_update
02 / DESIGN SYSTEM

Building once, scaling everywhere

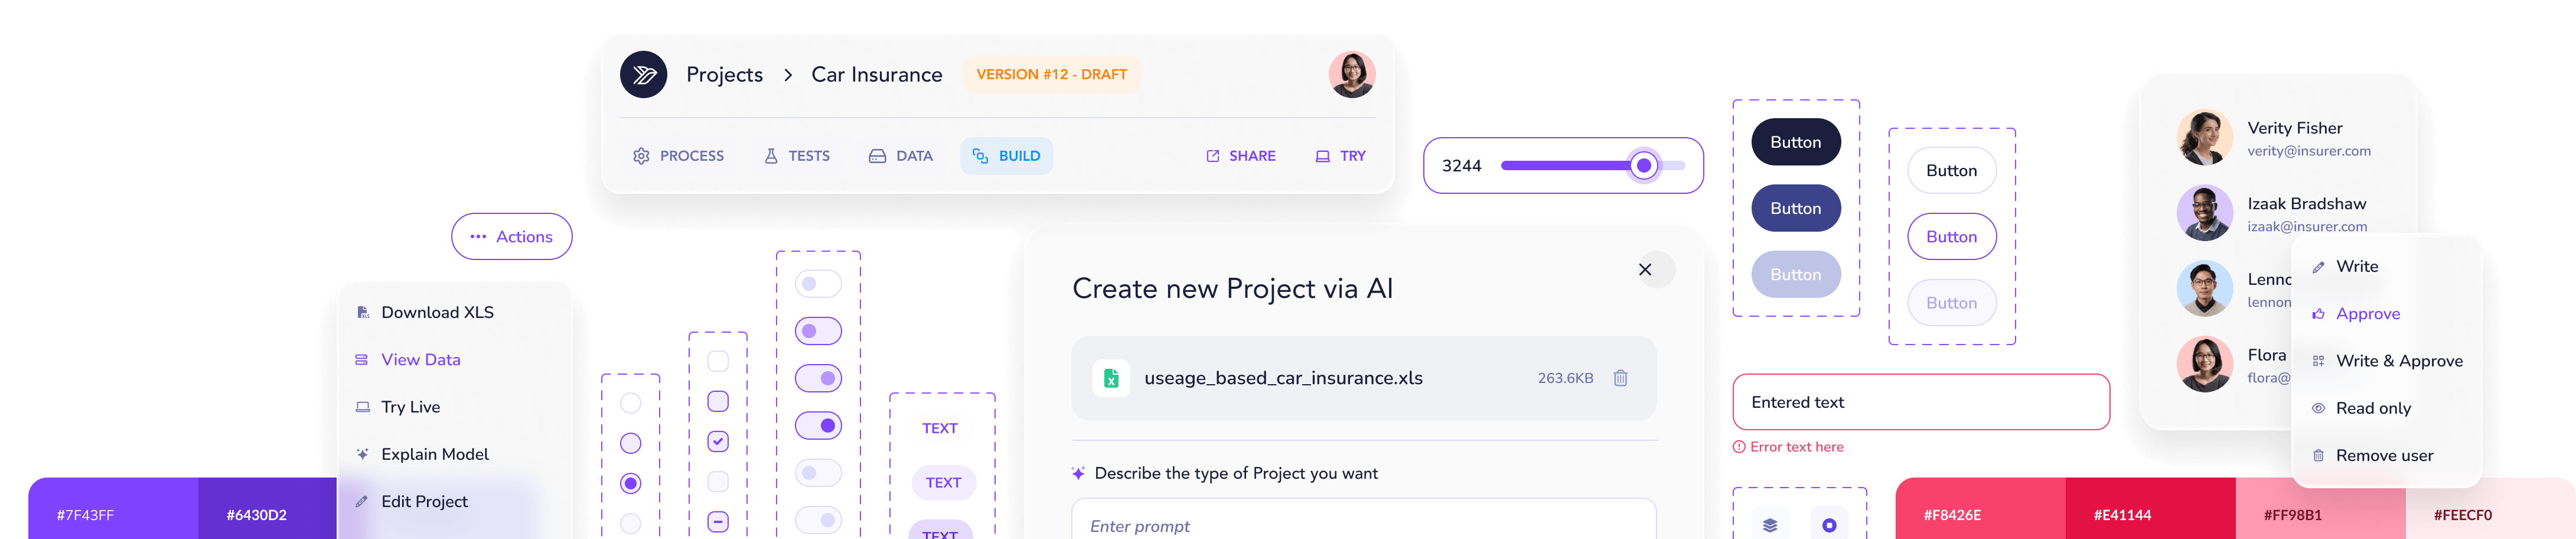
As Swallow grew, every new workflow brought more states, interactions and edge cases to solve. I built an atomic design system on a 4px grid, with reusable components and patterns that kept the experience consistent, accounted for real-world states and gave development a clear foundation to build from.

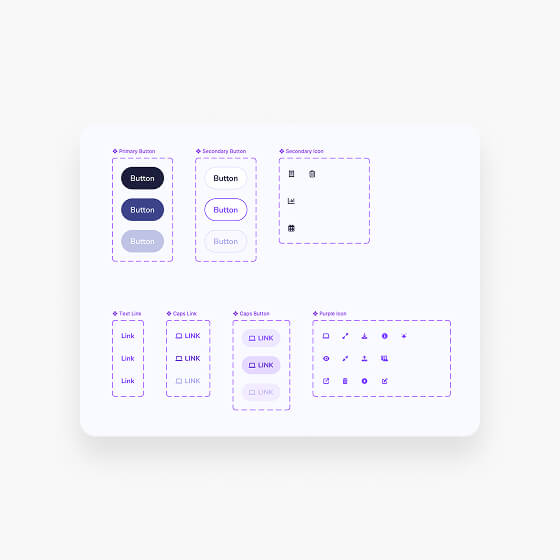
User interface design system showing a project dashboard for 'Car Insurance' with navigation tabs, action menu with options like Download XLS and Edit Project, toggle switches, button styles, text input fields, error messages, user list with profile pictures and email addresses, and color palette swatches in purple and red hues.

A website growing with the product

Swallow’s early website (before I began) was built around an MVP and a much simpler story. As the product matured, I evolved the site alongside it, finding clearer ways to communicate new capabilities and using the product itself to show customers what Swallow could do.

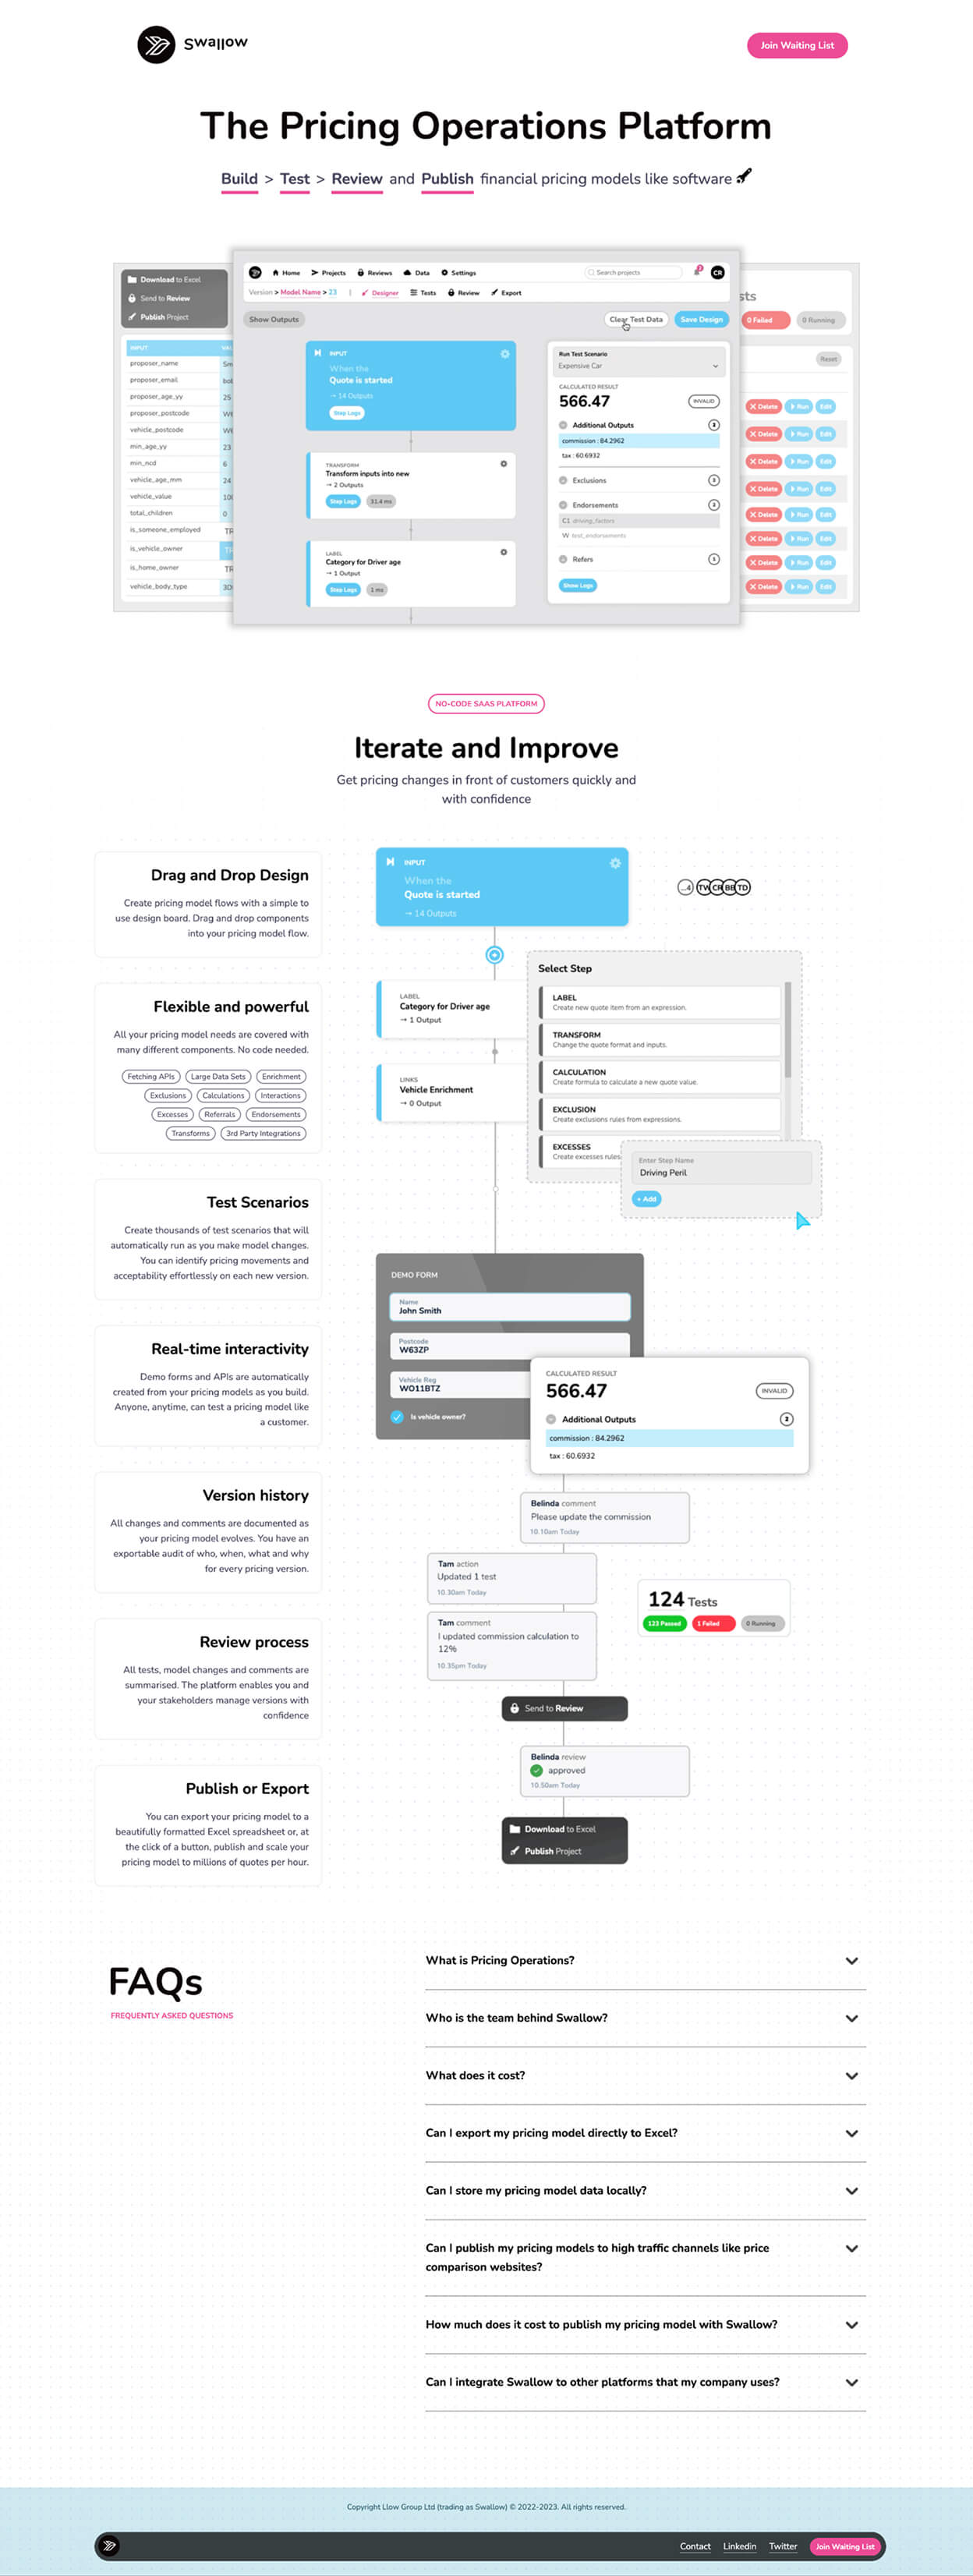
Swallow Pricing Operations Platform webpage with sections showing drag and drop design, flexible pricing model components, test scenarios, real-time interactivity, version history, review process, and publish or export options, including sample UI screenshots of pricing model inputs and calculations and an FAQ list with questions about pricing operations, team, cost, export, data storage, publishing, and integration.
Viewport_Archive // scroll
Web_Screenshot
OLD_Website

What began as a focused pricing tool was becoming a much broader platform, with more capabilities than a single page could comfortably communicate.

Features were presented through long descriptions and static UI, making an increasingly sophisticated product harder to understand at a glance

With one page doing everything from product education to FAQs, there was little room for new use cases, customer stories or the expanding world around Swallow

Making the product the story

As Swallow became more capable, the website needed to make an increasingly complex product feel immediate and easy to understand. I moved away from long feature explanations and brought the product itself into the experience, using real UI, focused interactions and motion to demonstrate how things worked.

Features became visual stories, helping customers understand the value of Swallow without needing to learn the technology behind it.

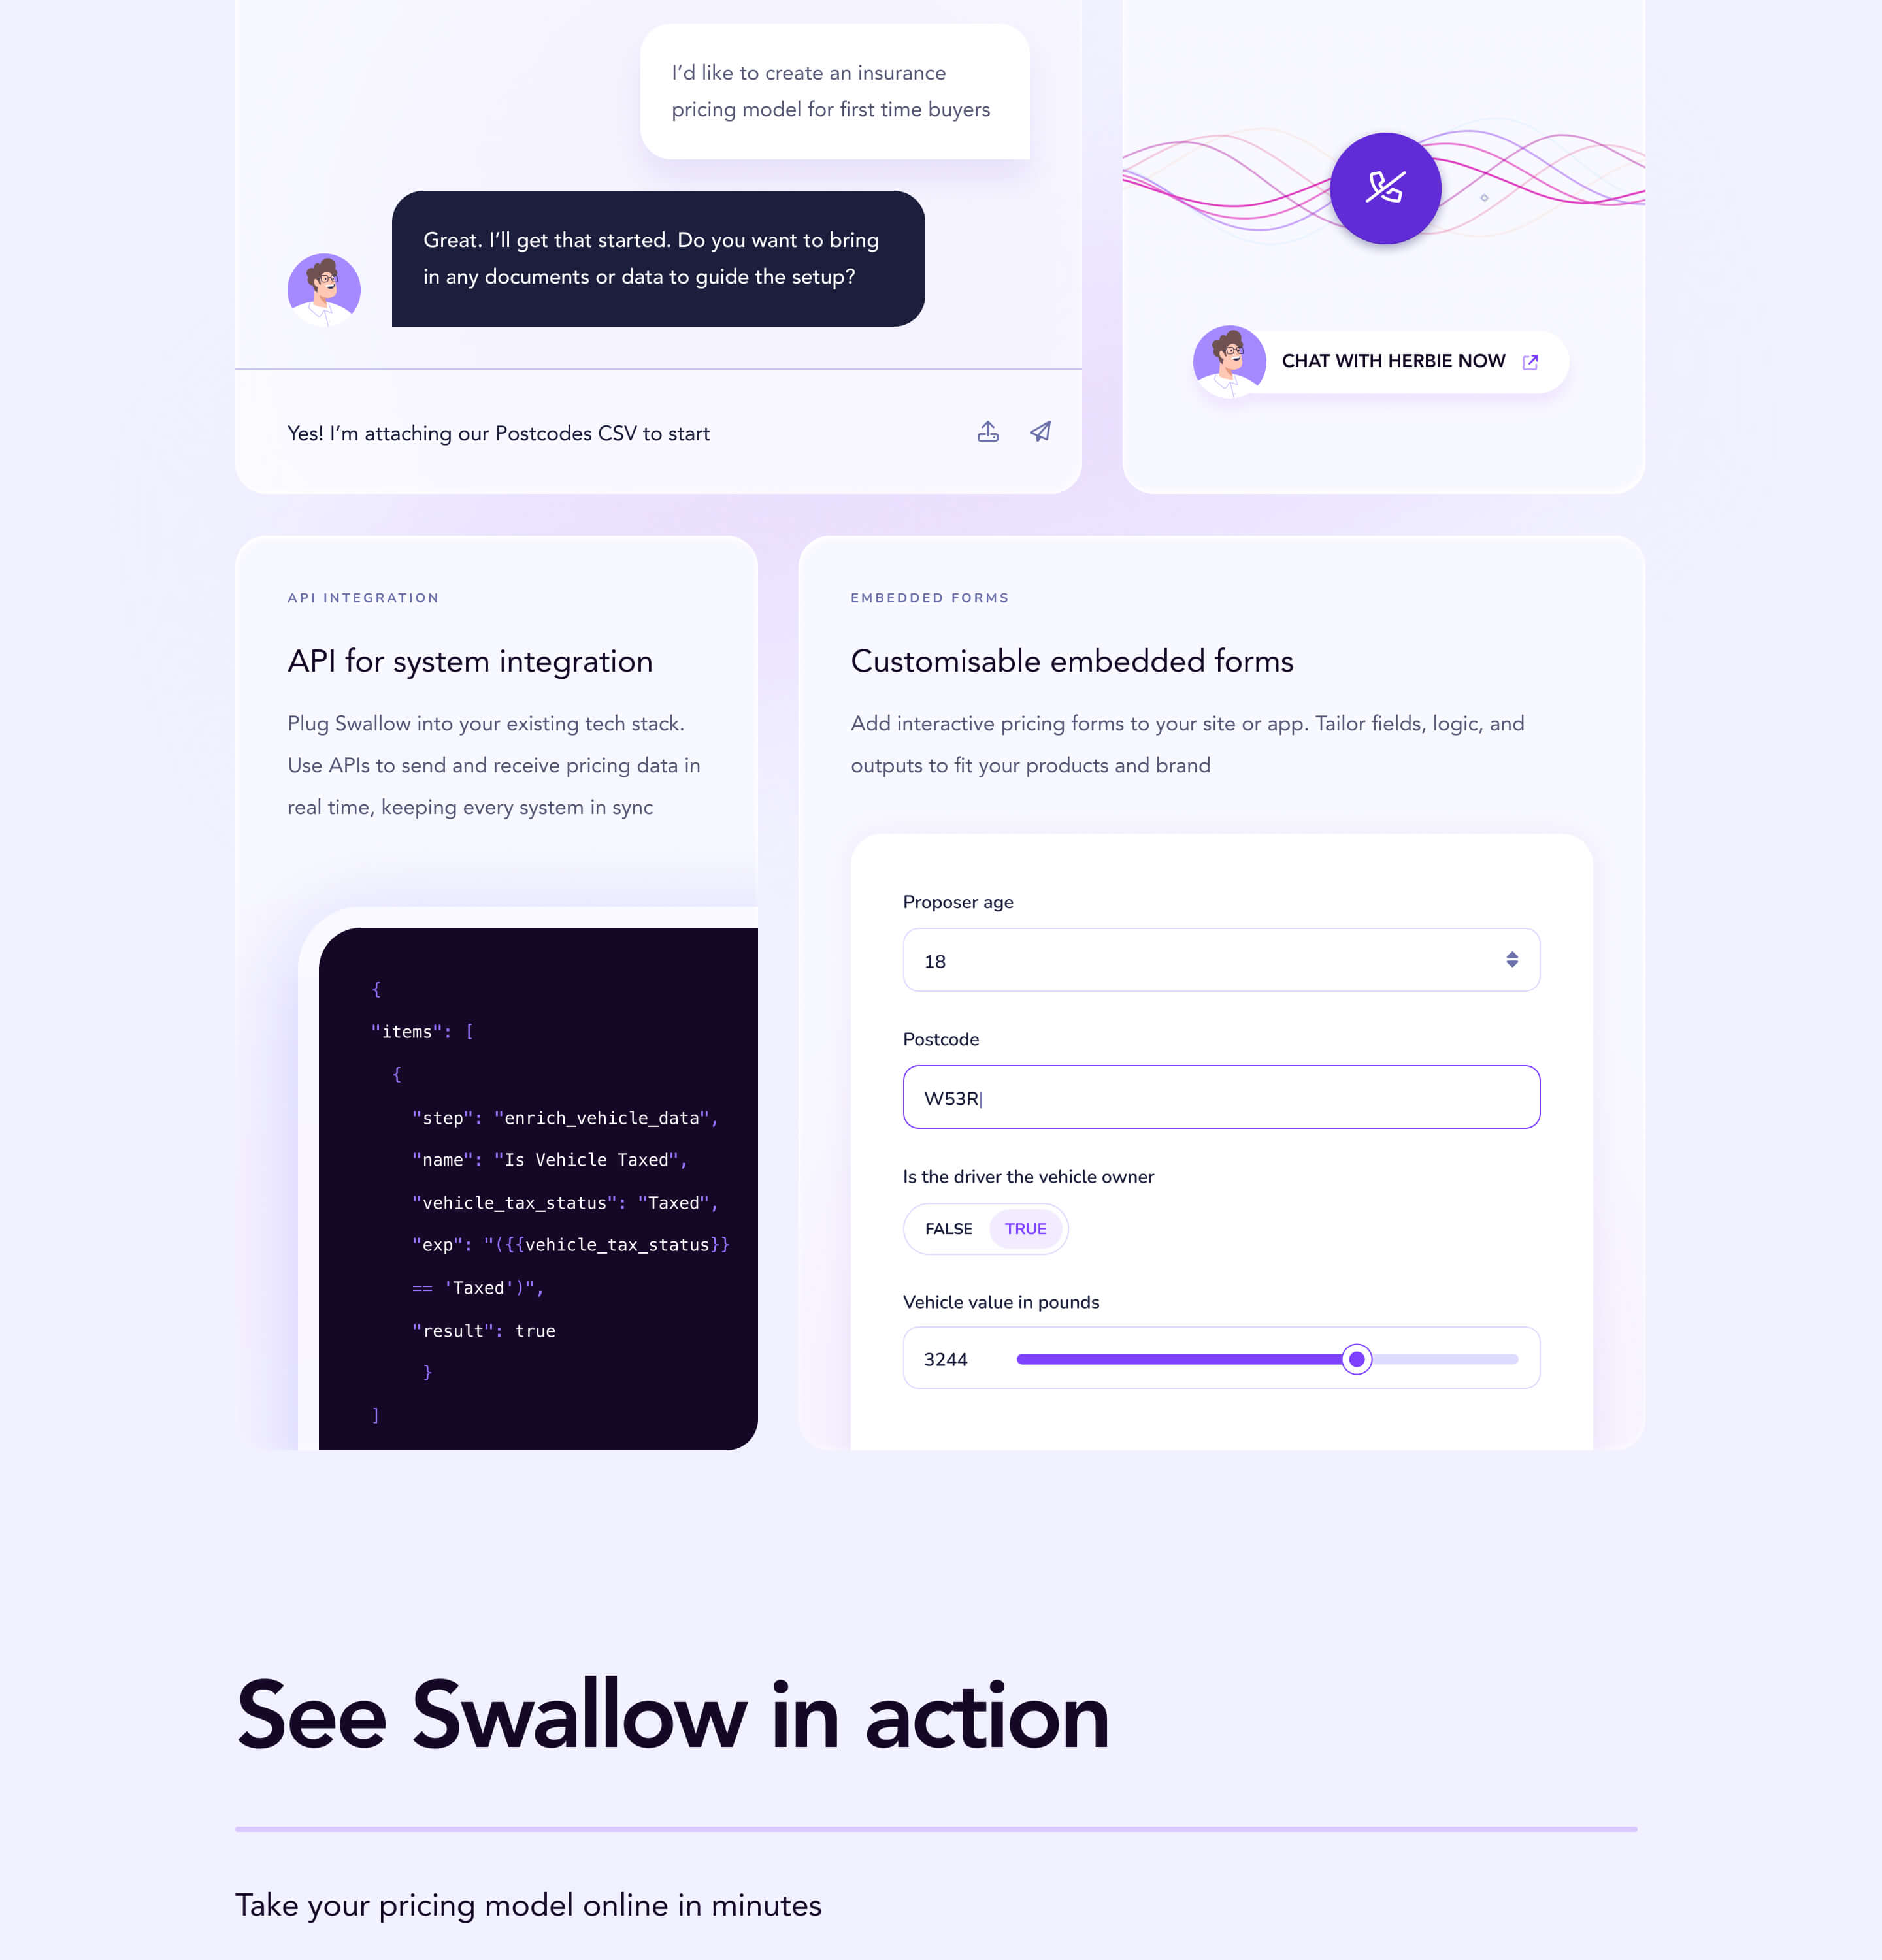
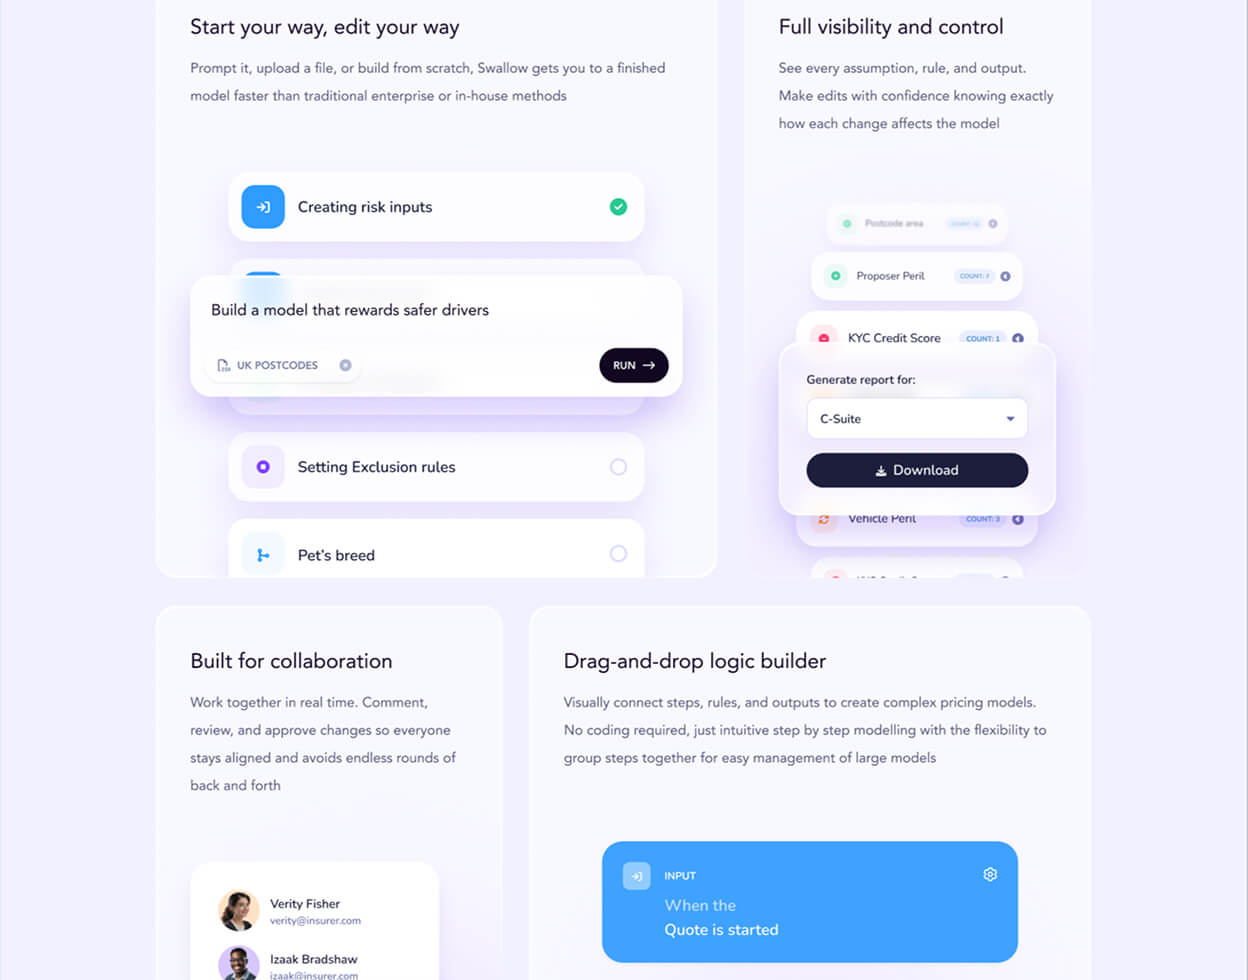
User interface screen divided into four sections explaining features of a software. Top left titled 'Start your way, edit your way' with steps like Creating risk inputs, Building a model that rewards safer drivers with a 'Run' button, Setting Exclusion rules, and Pet's breed. Top right titled 'Full visibility and control' showing selectable options like Proposer Peril, KYC Credit Score, and a report generation drop-down menu set to 'C-Suite' with a Download button. Bottom left titled 'Built for collaboration' with user avatars and emails. Bottom right titled 'Drag-and-drop logic builder' with a blue input block labeled 'When the Quote is started'.
Viewport_features_page
Web_Screenshot
02 / WEB EVOLUTION

Three years of evolution

As Swallow expanded, the website grew far beyond its original single page. Over more than three years, I evolved both its structure and visual language, adding dedicated spaces for features, enterprise, pricing, case studies, a blog and more content as the business changed. The collection below captures part of the site at different stages of that evolution, from its lighter early iterations through to the more mature experience it is today.

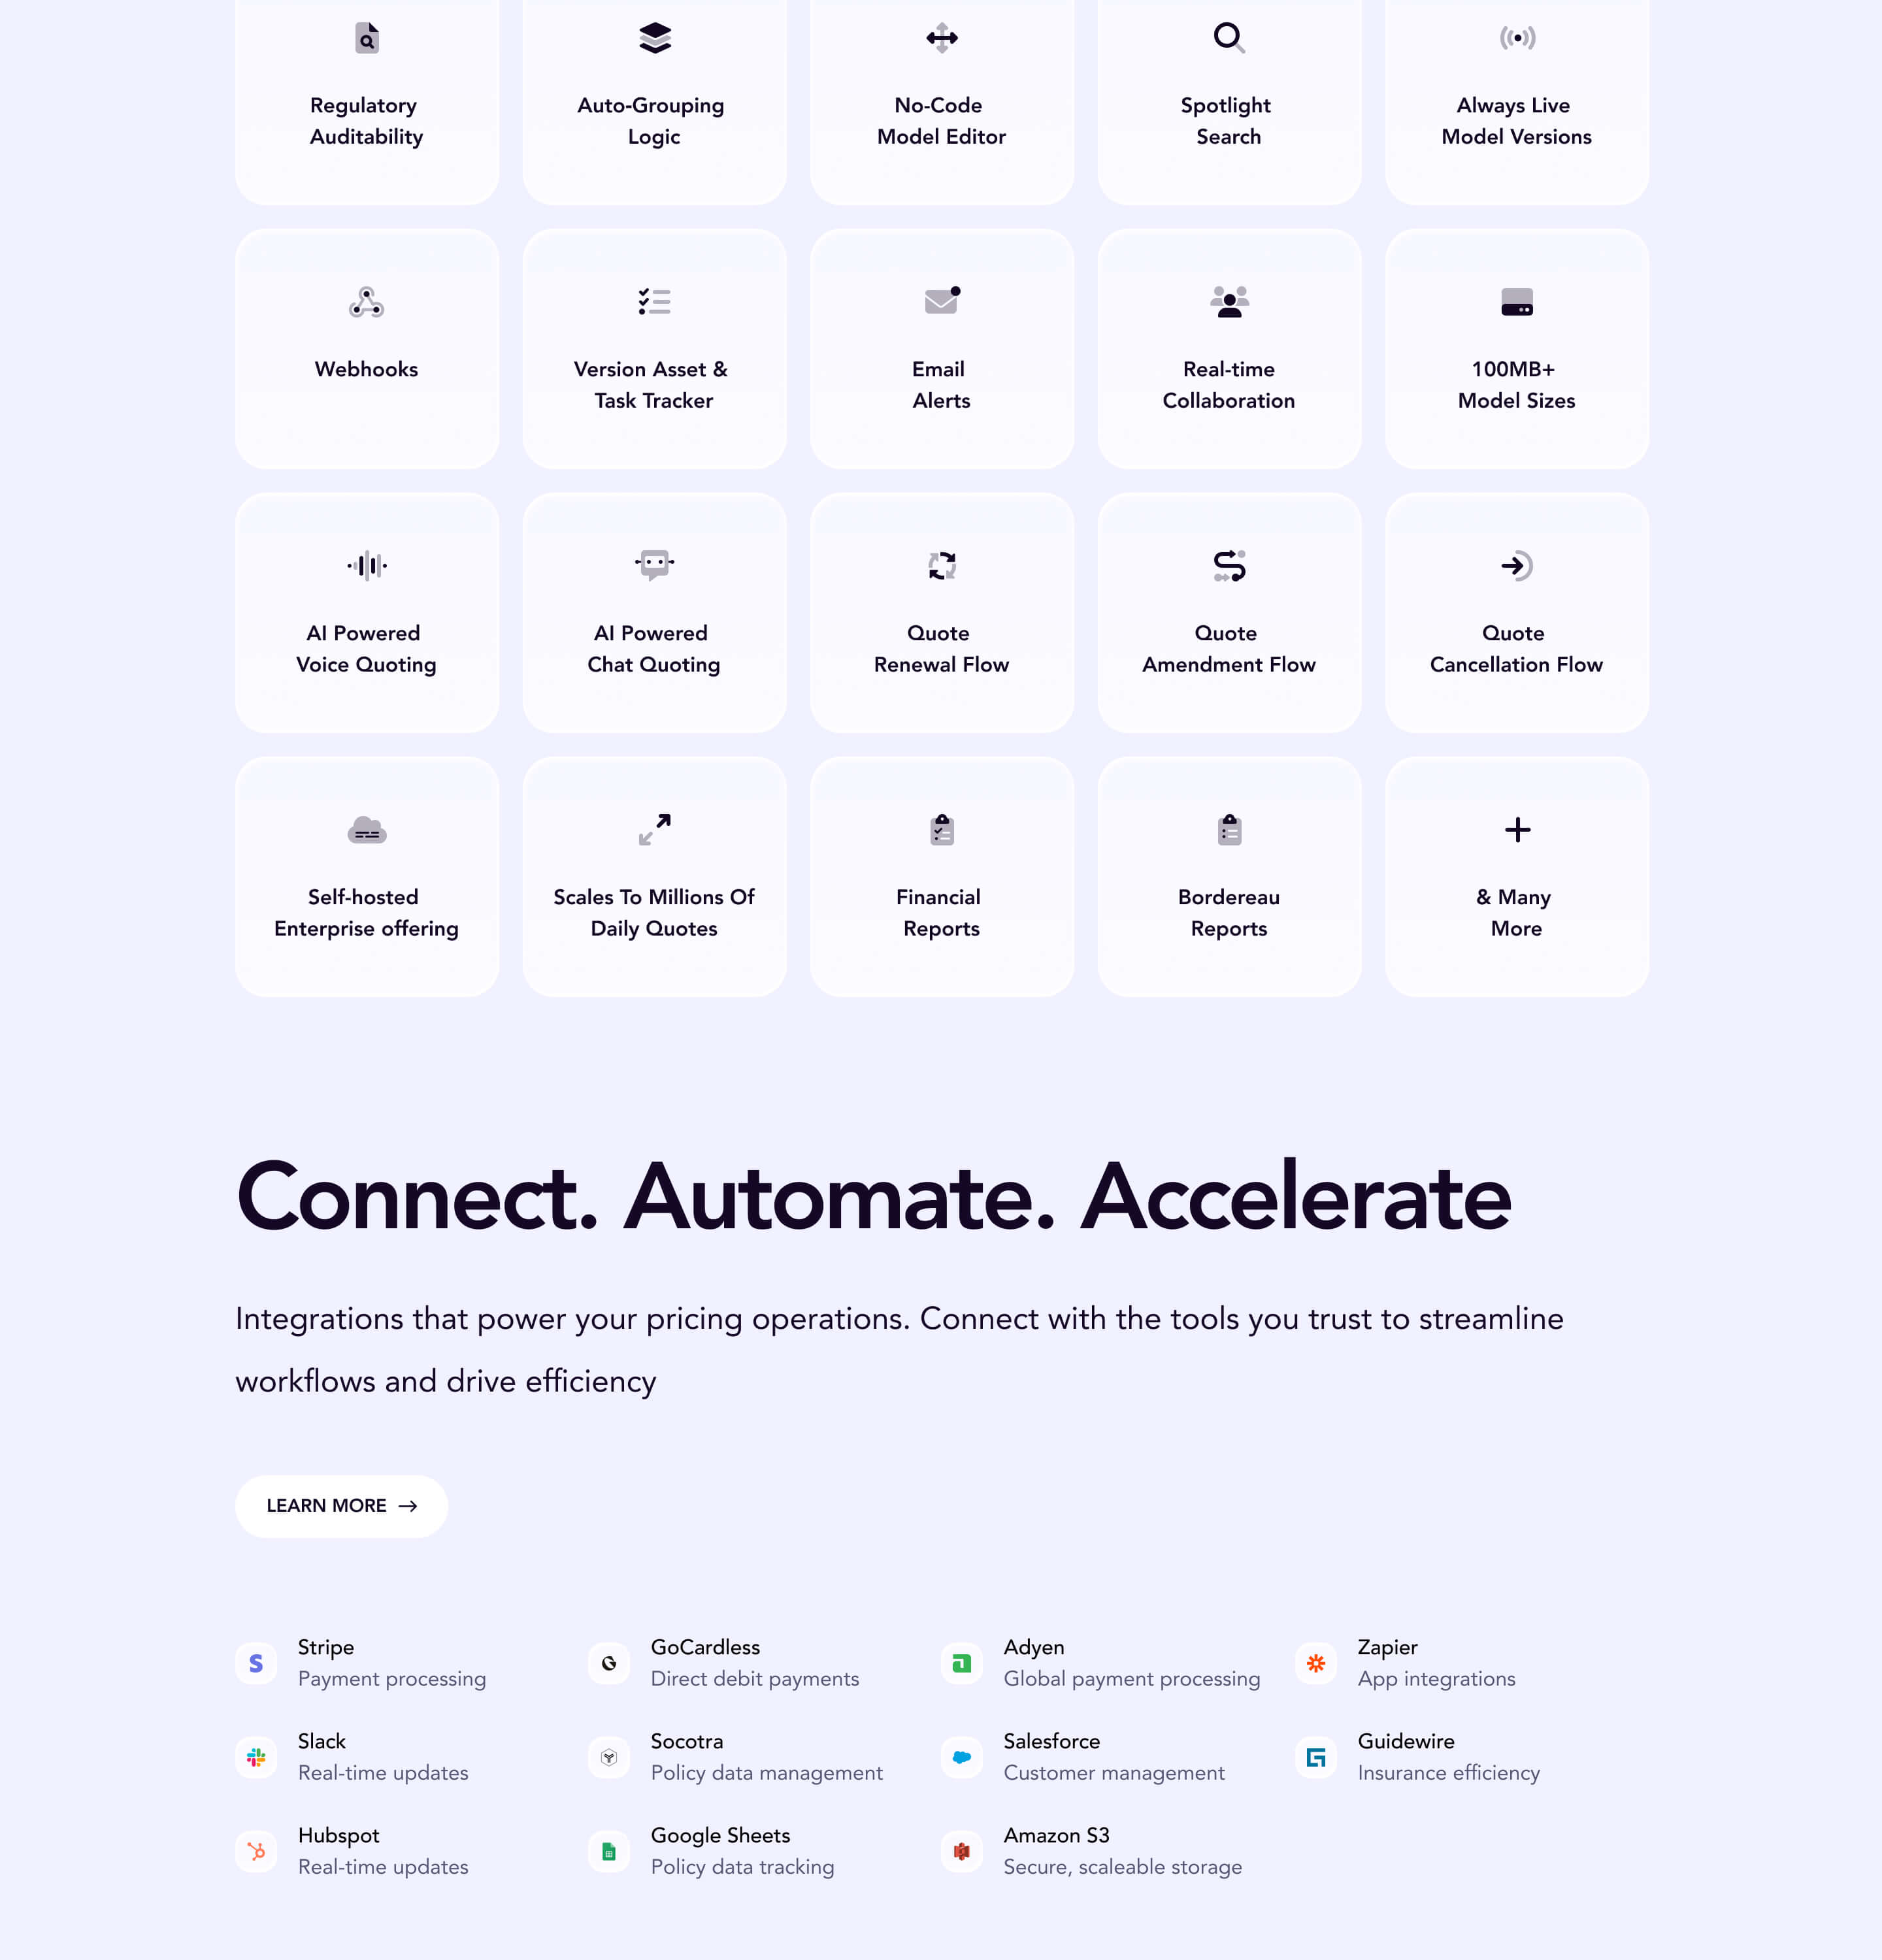
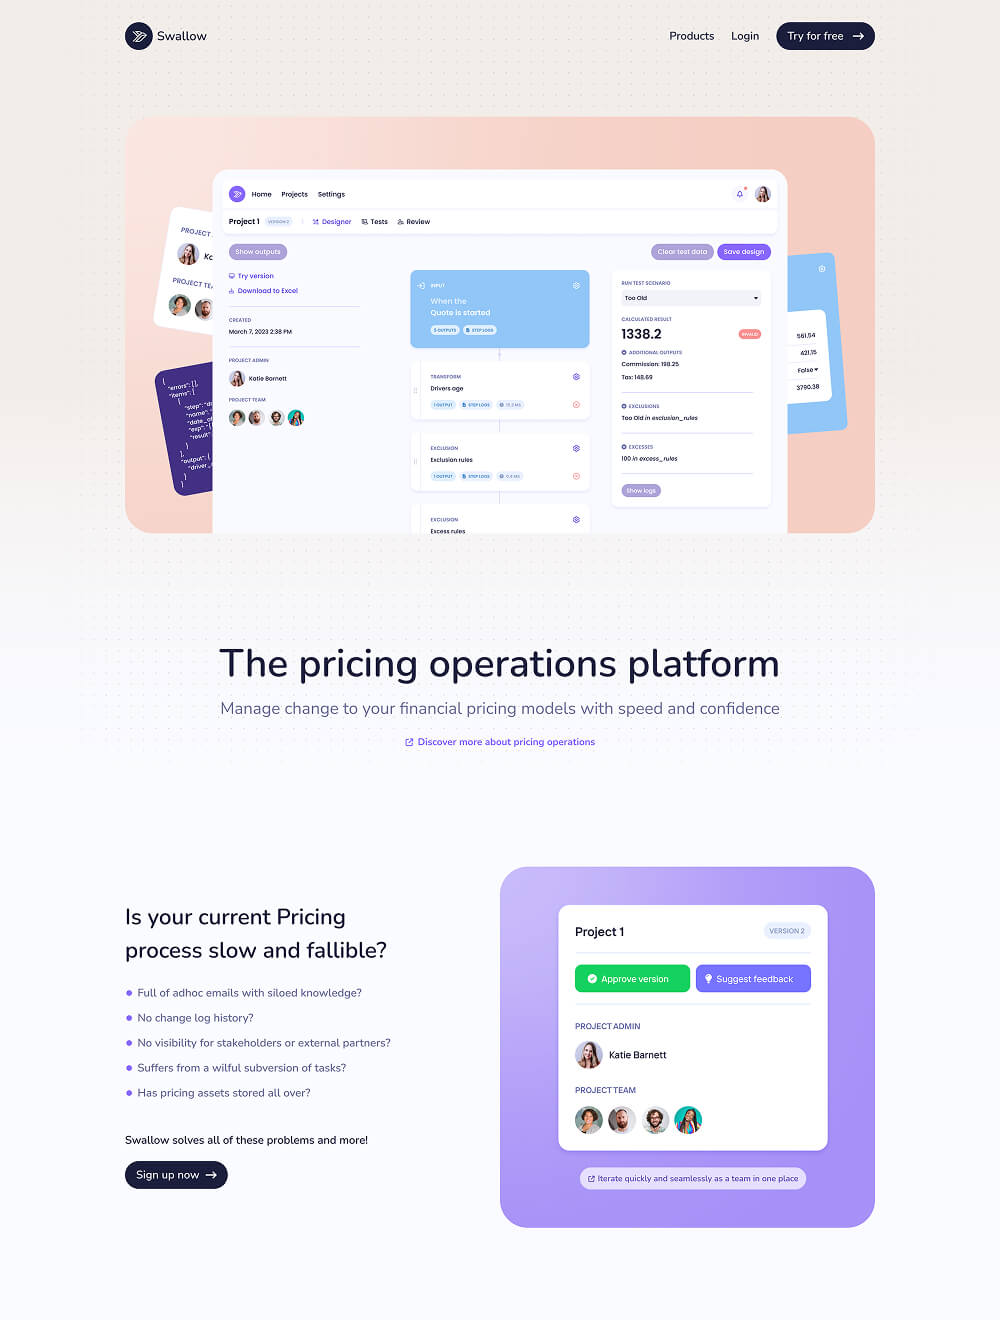
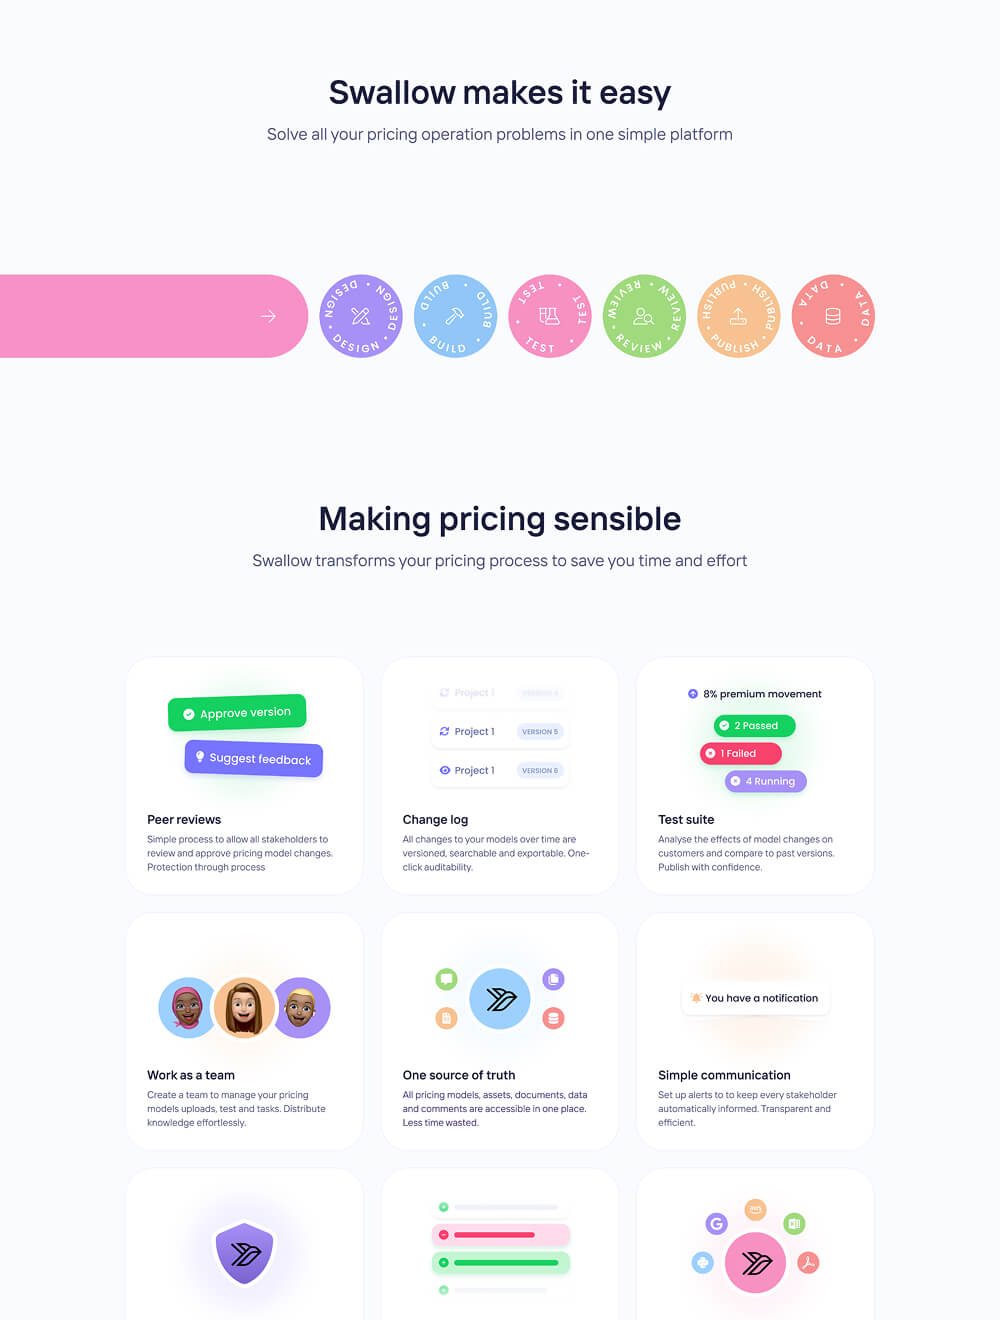
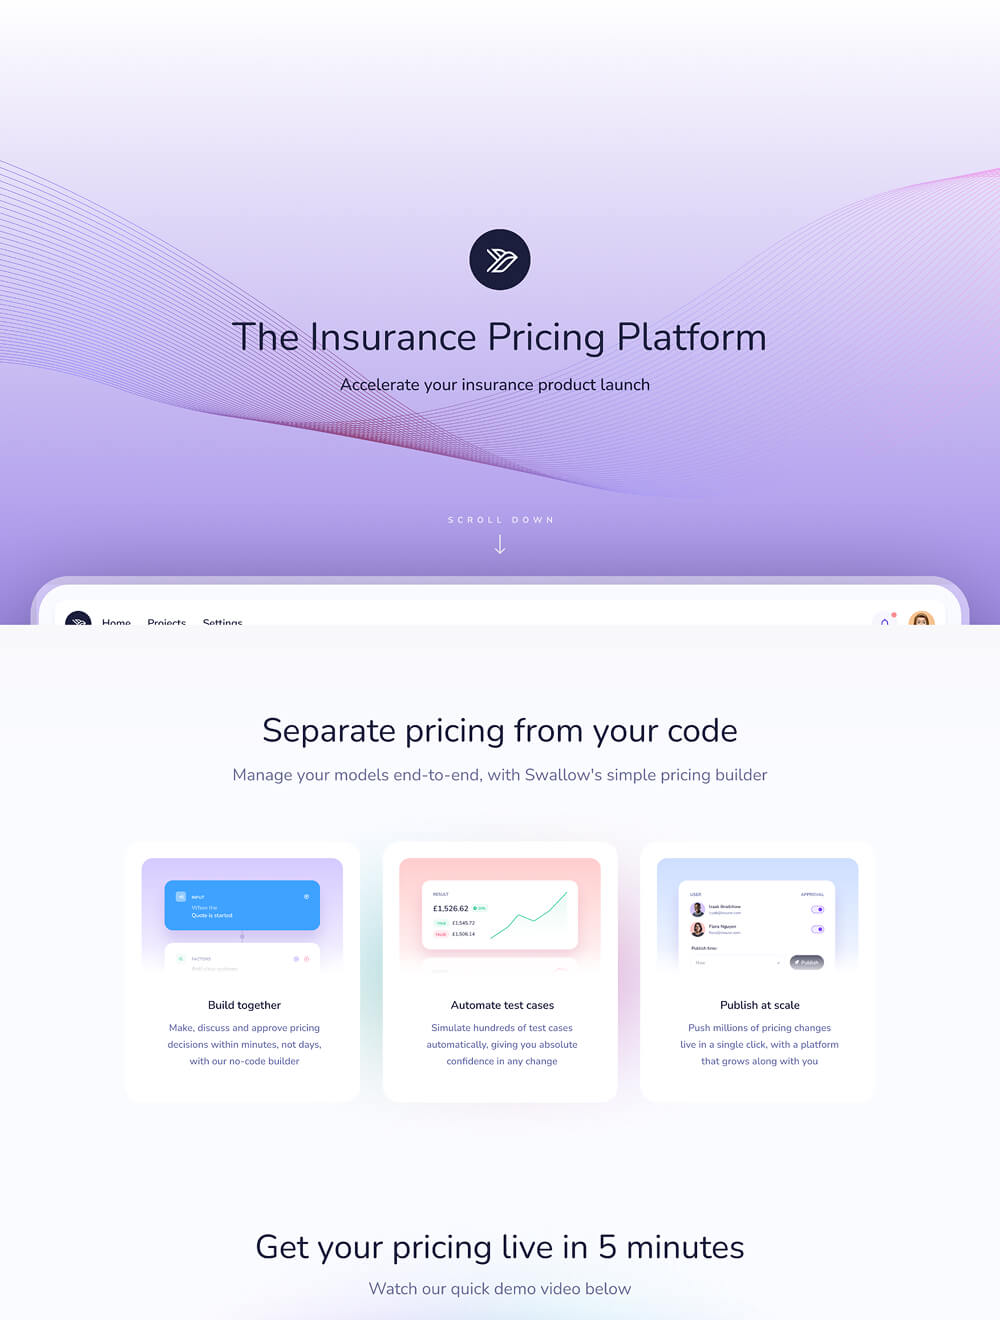
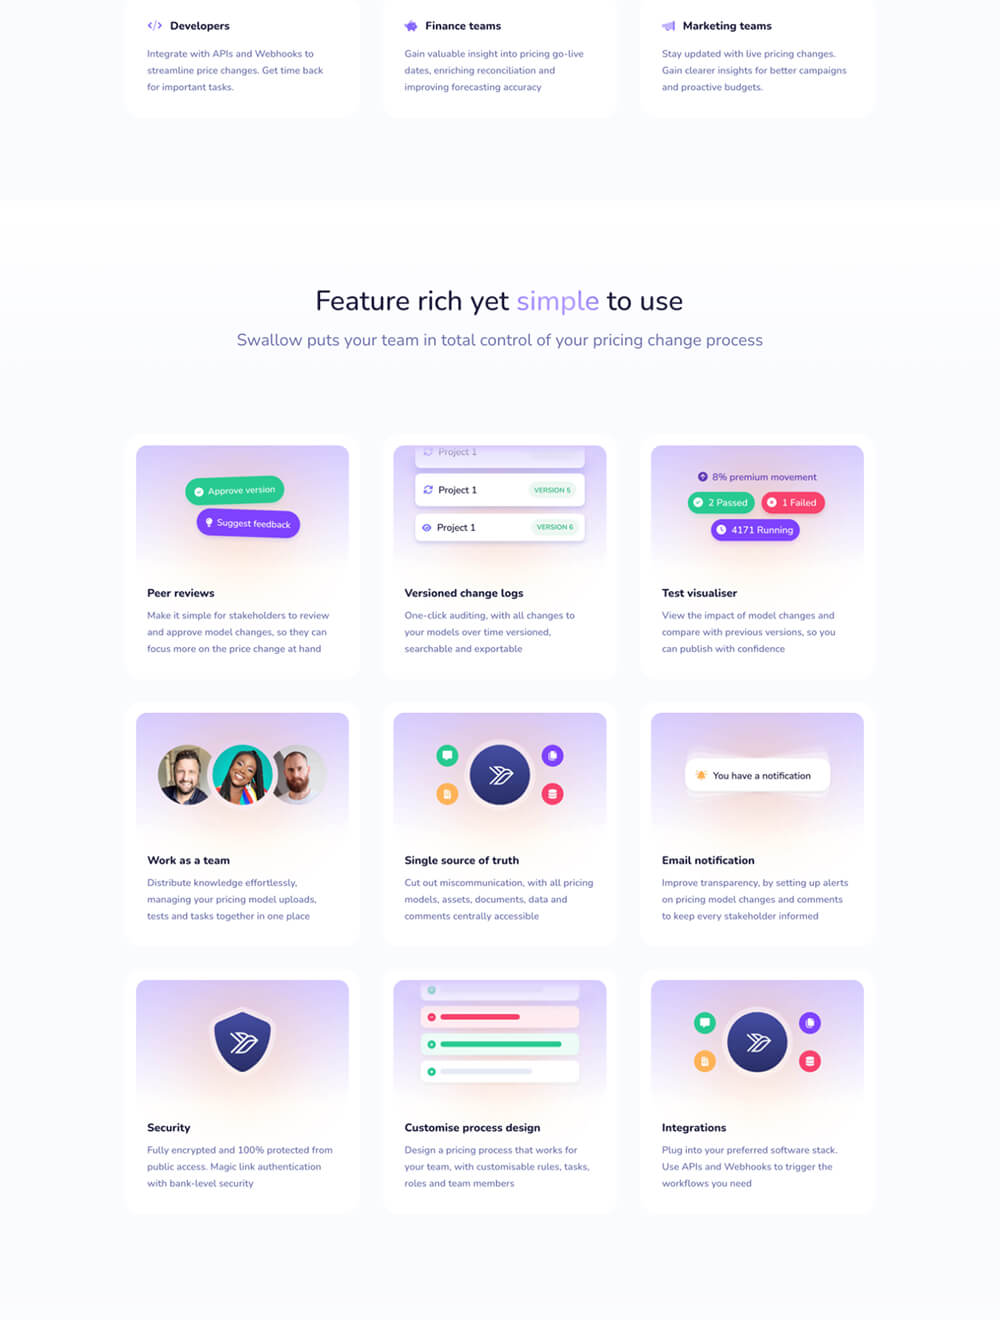
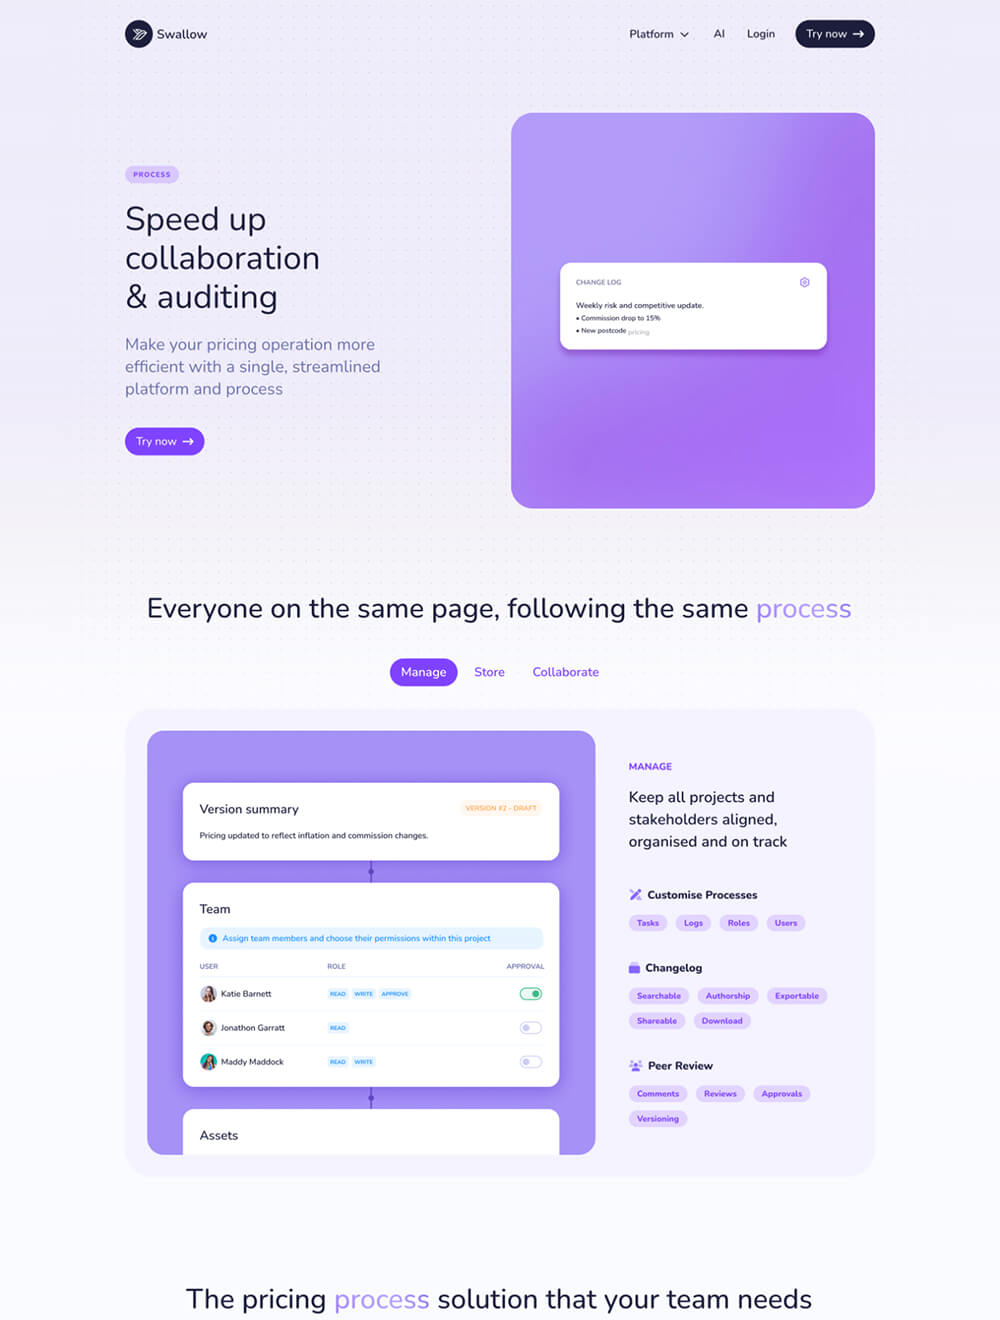
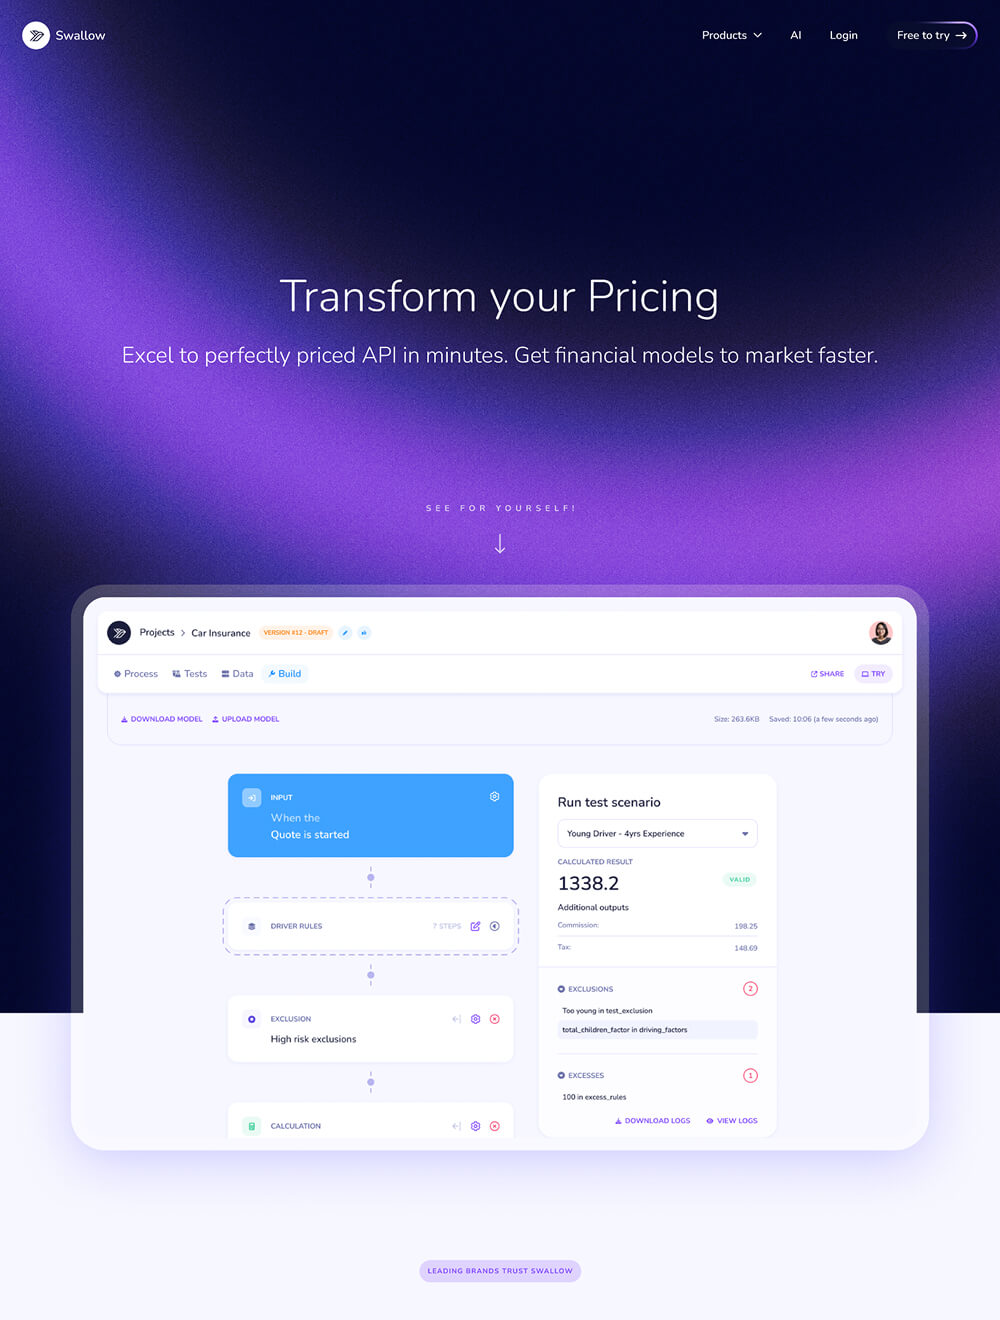
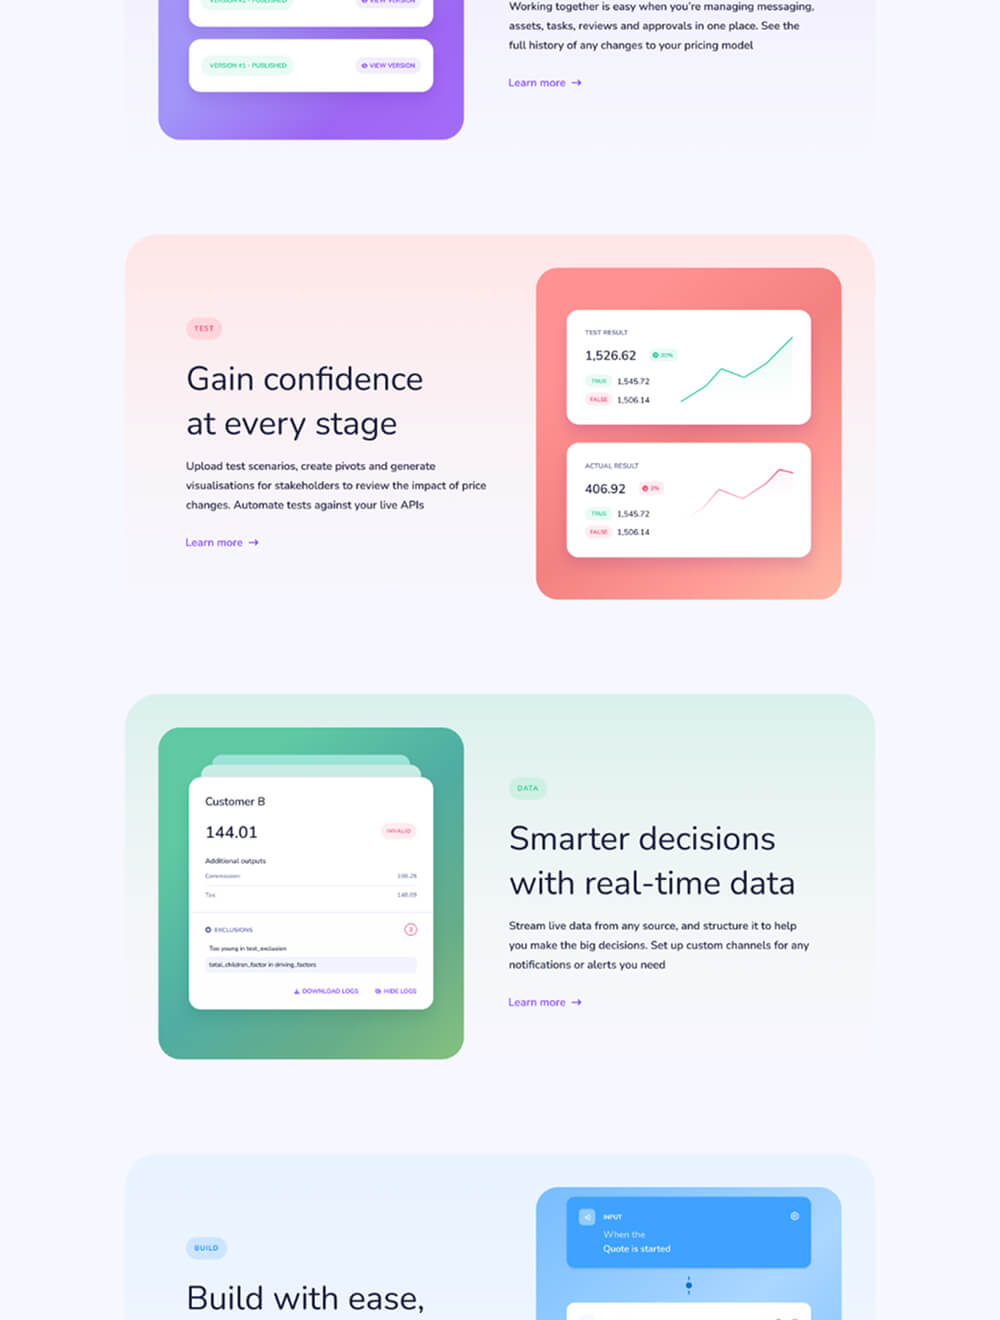
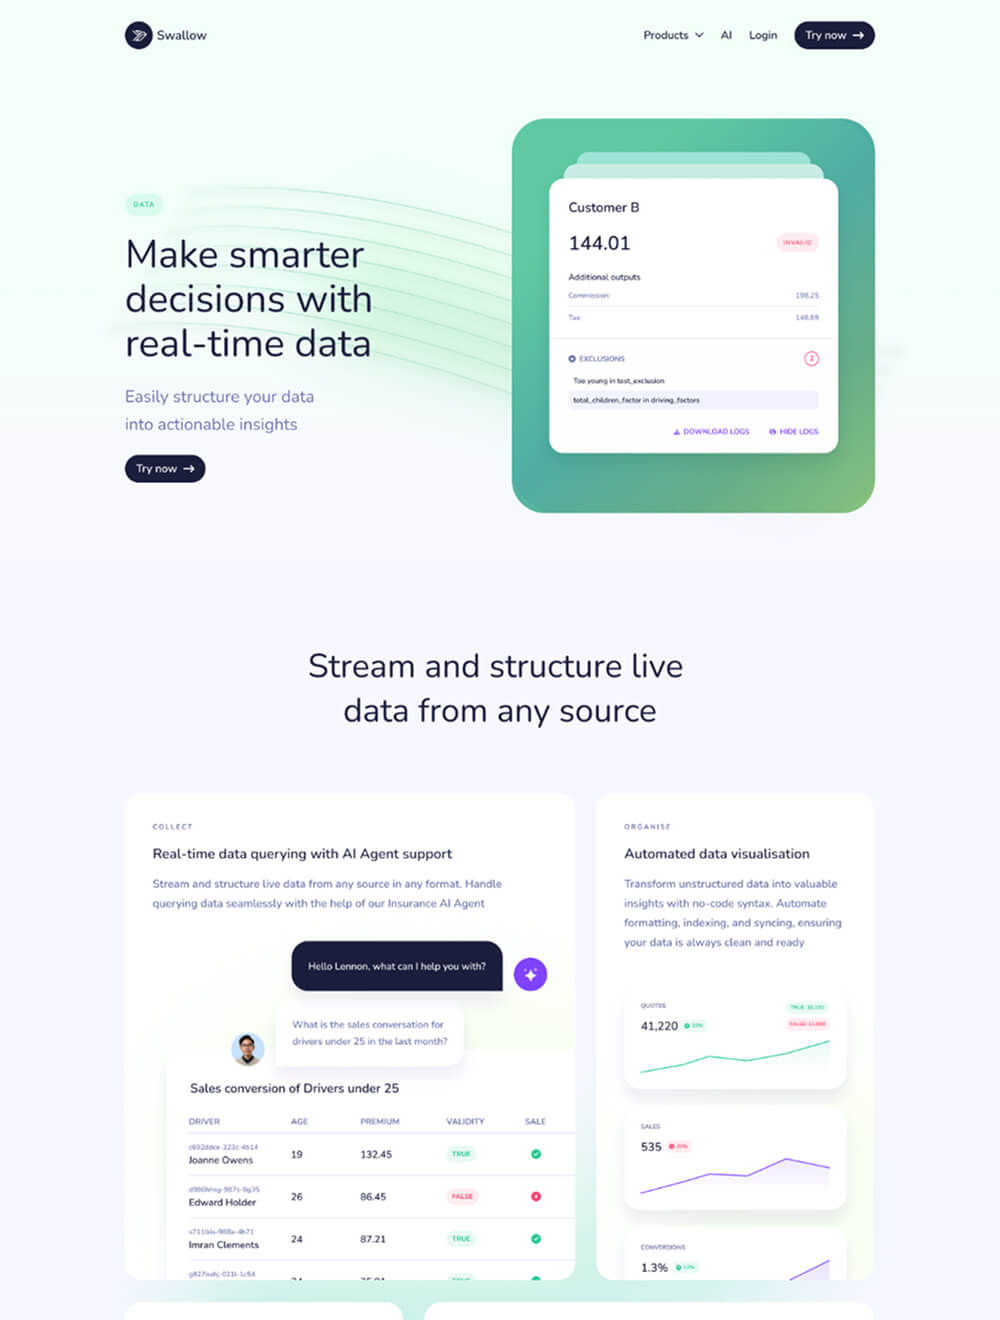
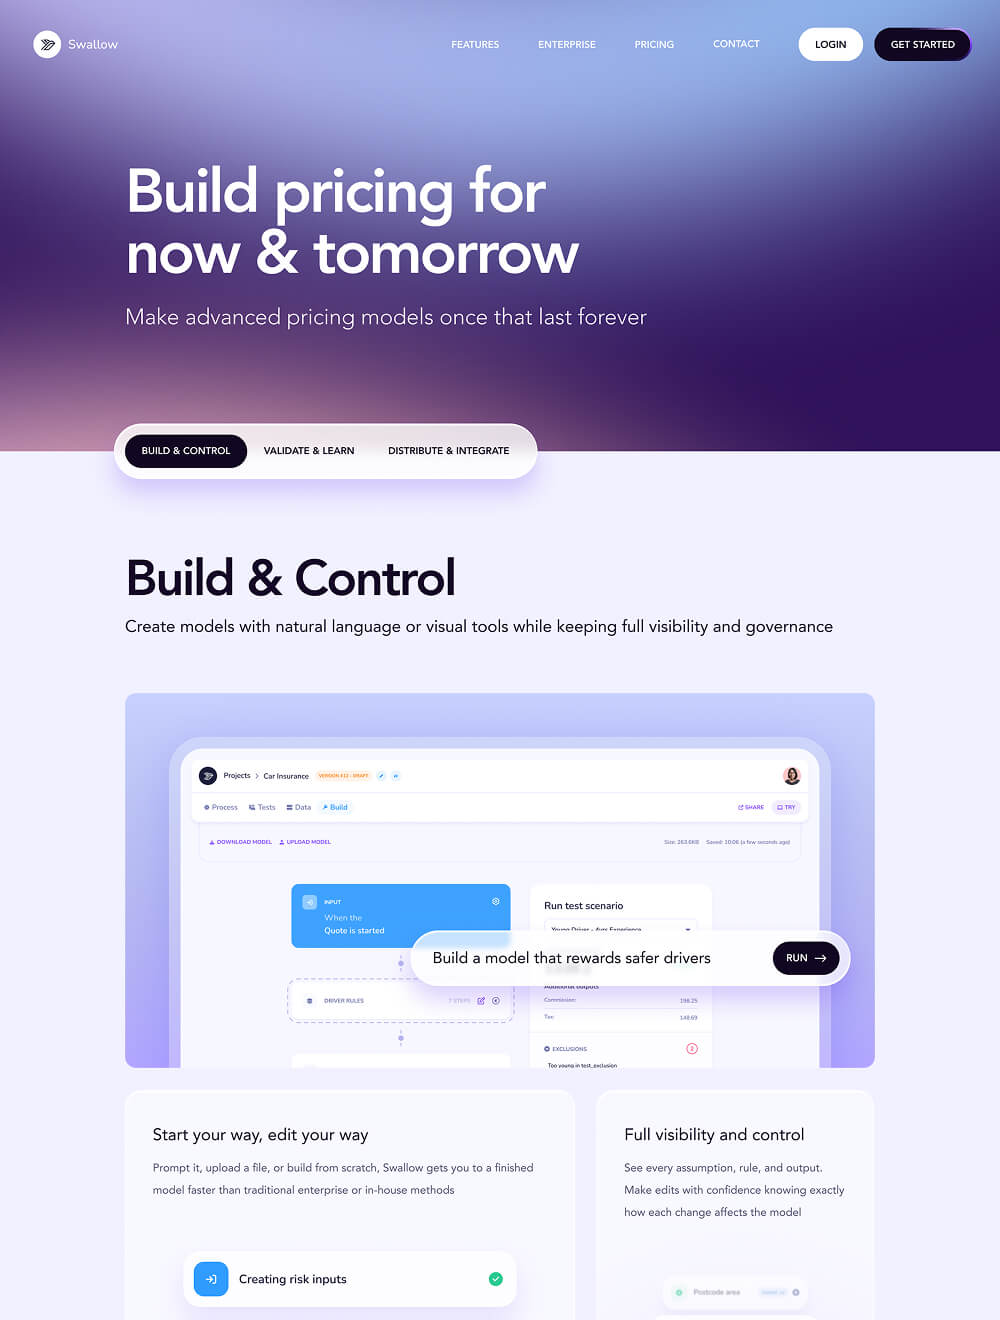
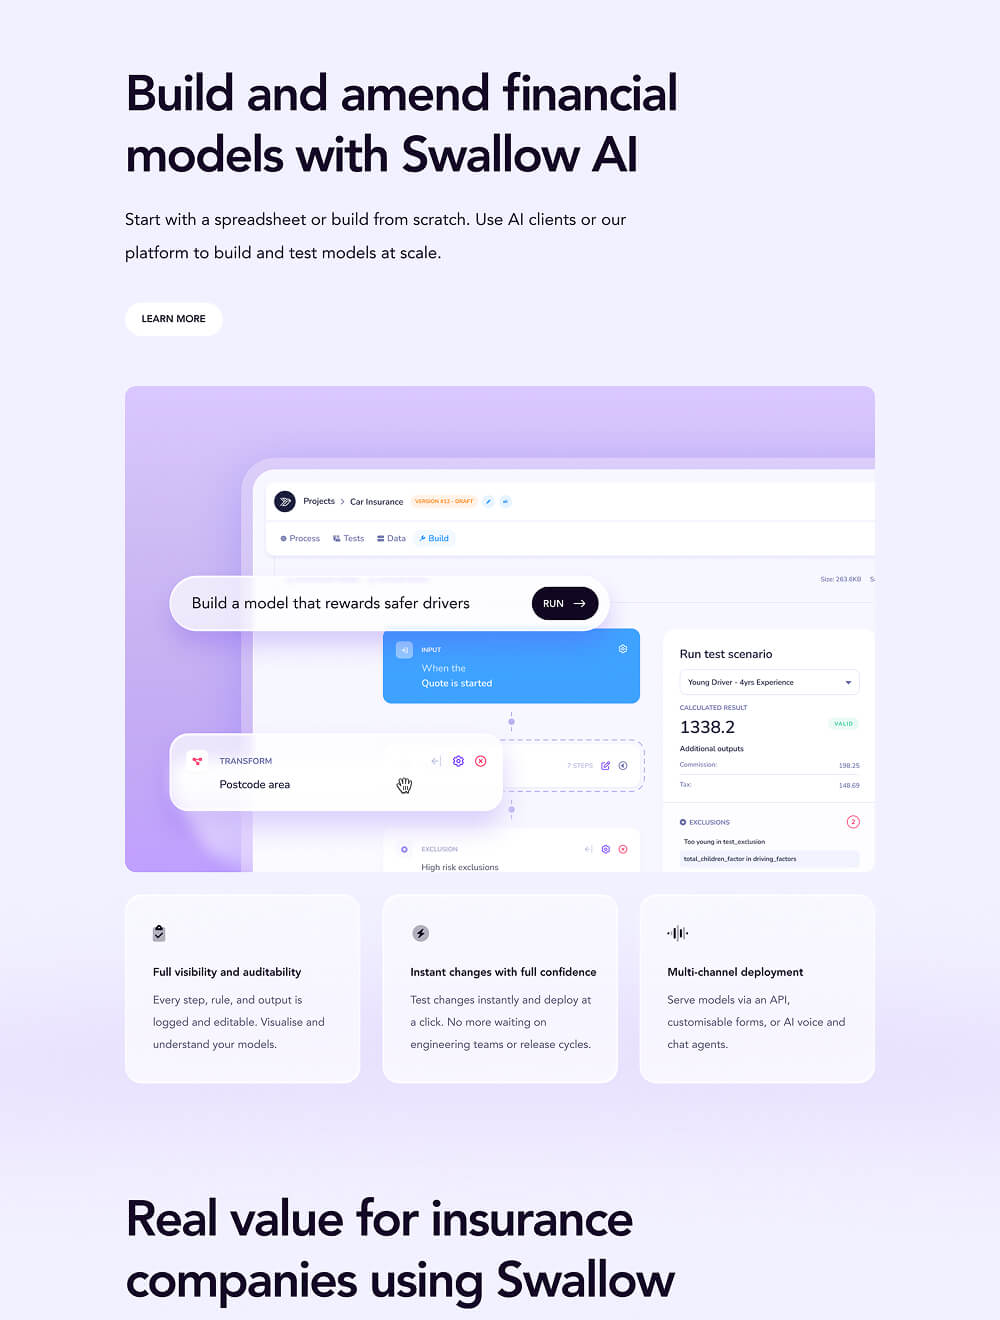
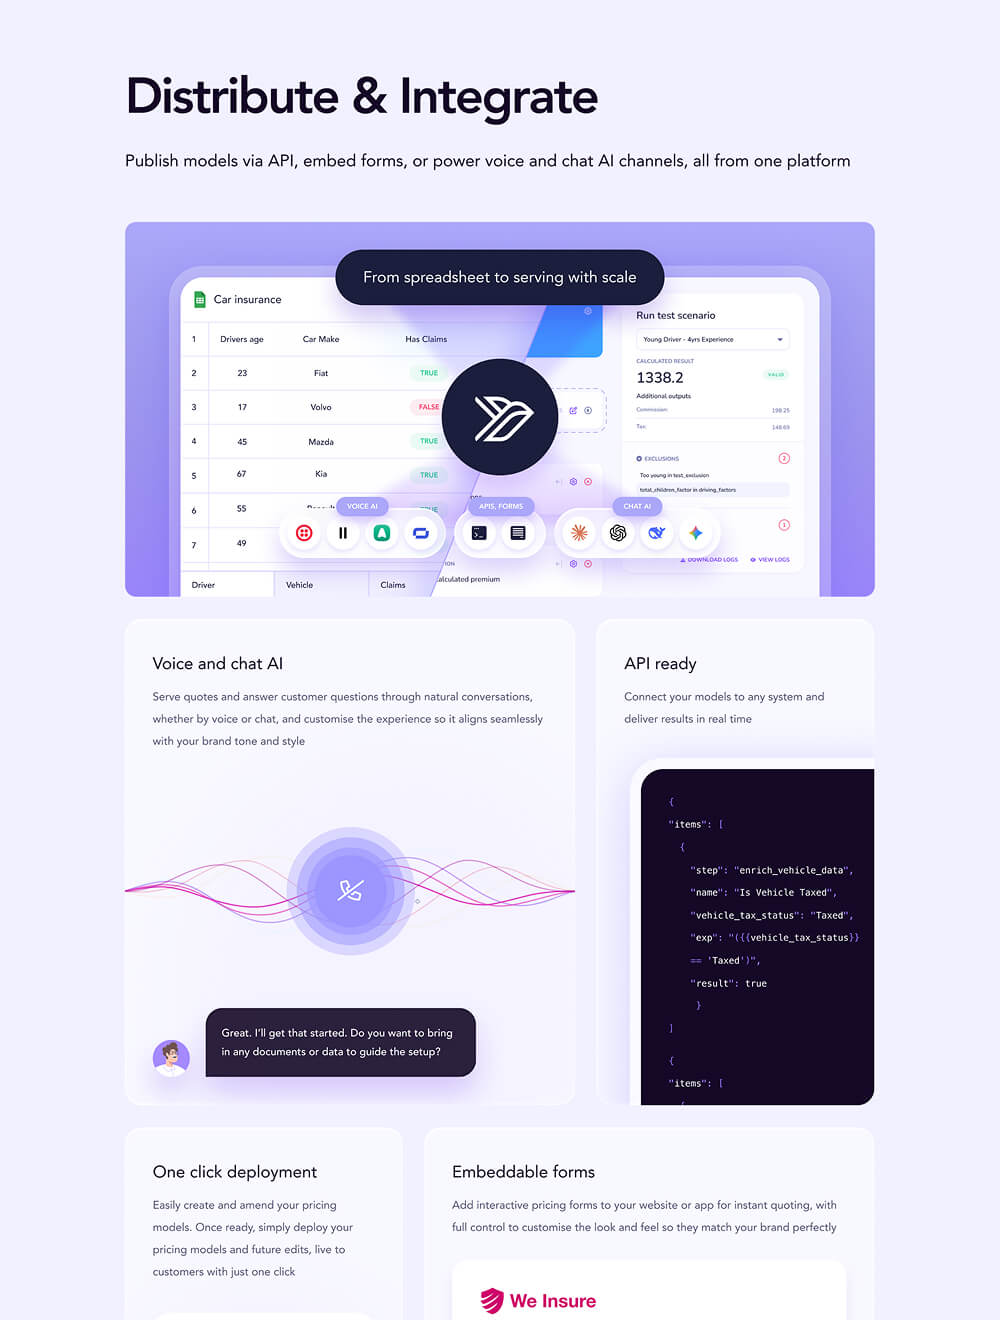
Webpage screenshot of Swallow pricing operations platform highlighting a dashboard interface with project management features. The page includes text about managing financial pricing models, lists common pricing process problems like lack of change logs and siloed knowledge, and offers a sign-up button. The dashboard shows project details, admin Katie Barnett, project team members, options to approve version or suggest feedback, and a summary of pricing calculations and rules.User interface design for Swallow pricing platform showing workflow steps: Design, Build, Test, Review, Publish, Data; and features like peer reviews with approve and suggest feedback buttons, change log with version history, test suite status with passed, failed, running, team collaboration avatars, centralized data source with icons, simple communication notification, and graphical elements representing security and task progress.Website landing page for an insurance pricing platform named Swallow featuring a purple gradient background with wave lines, a small bird logo above the title, and sections highlighting features: building pricing collaboratively with a no-code builder, automating test cases to simulate changes, and publishing pricing changes at scale, plus a call to action to get pricing live in five minutes.User interface layout showing features of a pricing change management tool called Swallow, highlighting peer reviews, versioned change logs, test visualizer, teamwork, single source of truth, email notifications, security, customizable process design, and integrations, each with brief descriptions and icon visuals on a light purple gradient background.Website interface for Swallow platform showing features to speed up collaboration and auditing, with sections highlighting process streamlining, task and role management, changelog, and peer review for pricing operations.Swallow website homepage with dark blue and purple background featuring headline 'Transform your Pricing' and subtext about Excel to API for financial models, with a screenshot of an insurance pricing API interface showing input, driver rules, exclusions, calculation, and test scenario results for a young driver.Three sections showing software features: Gain confidence at every stage with test results charts, Smarter decisions with real-time data including customer outputs, and a partially visible Build with ease section.Website interface for Swallow showing features of making smarter decisions with real-time data, including AI agent-supported data querying, automated data visualization, and sample sales conversion data for drivers under 25 with validity and sales indicators.Website header and section for Swallow AI pricing infrastructure aimed at insurers, featuring text about building, testing, and deploying financial pricing models with AI, a prompt box to build a model rewarding safer drivers with a run button, navigation links for features, enterprise, pricing, contact, and login, logos of trusted brands, and a section inviting users to build and amend financial models with Swallow AI using spreadsheets or the platform, with a learn more button.Swallow pricing software webpage with headline 'Build pricing for now & tomorrow' and subheading about advanced pricing models lasting forever. Navigation includes Features, Enterprise, Pricing, Contact, Login, and Get Started buttons. Section titled 'Build & Control' highlights creating models with natural language or visual tools for visibility and governance. Screenshot of tool interface shows a flow for building a model that rewards safer drivers with a Run button. Below are features like 'Start your way, edit your way' and 'Full visibility and control' describing easy model creation and editing with confidence.Website section promoting Swallow AI for building and amending financial models, featuring a screenshot of the platform with a model builder interface for car insurance, showing inputs, transforms, exclusions, and test scenario results; also highlights features like full visibility and auditability, instant changes, and multi-channel deployment for insurance companies.Web page section titled 'Distribute & Integrate' explaining publishing models via API, forms, voice, and chat AI. Includes an interface graphic showing a car insurance spreadsheet and AI integration icons labeled Voice AI, APIs & Forms, and Chat AI. Below are four panels describing features: Voice and chat AI for customer conversations, API ready for real-time results, one-click deployment to amend pricing models, and embeddable interactive pricing forms for websites or apps.Dashboard interface titled 'Validate & Learn' showing testing features for data-driven model insights with real-time previews, automated testing, reporting, and data insights including graphs and test results for car insurance scenarios.

Building a brand that could grow with Swallow

The product and website changed significantly over the years, and the identity evolved with them. Starting with my initial redesign of Swallow’s early brand, I continued refining its visual language into something more confident and flexible, creating a brand that could feel equally at home across product, web and everything around them.

Giving Swallow its visual language

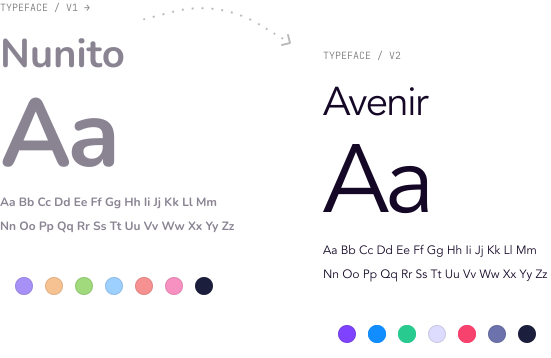
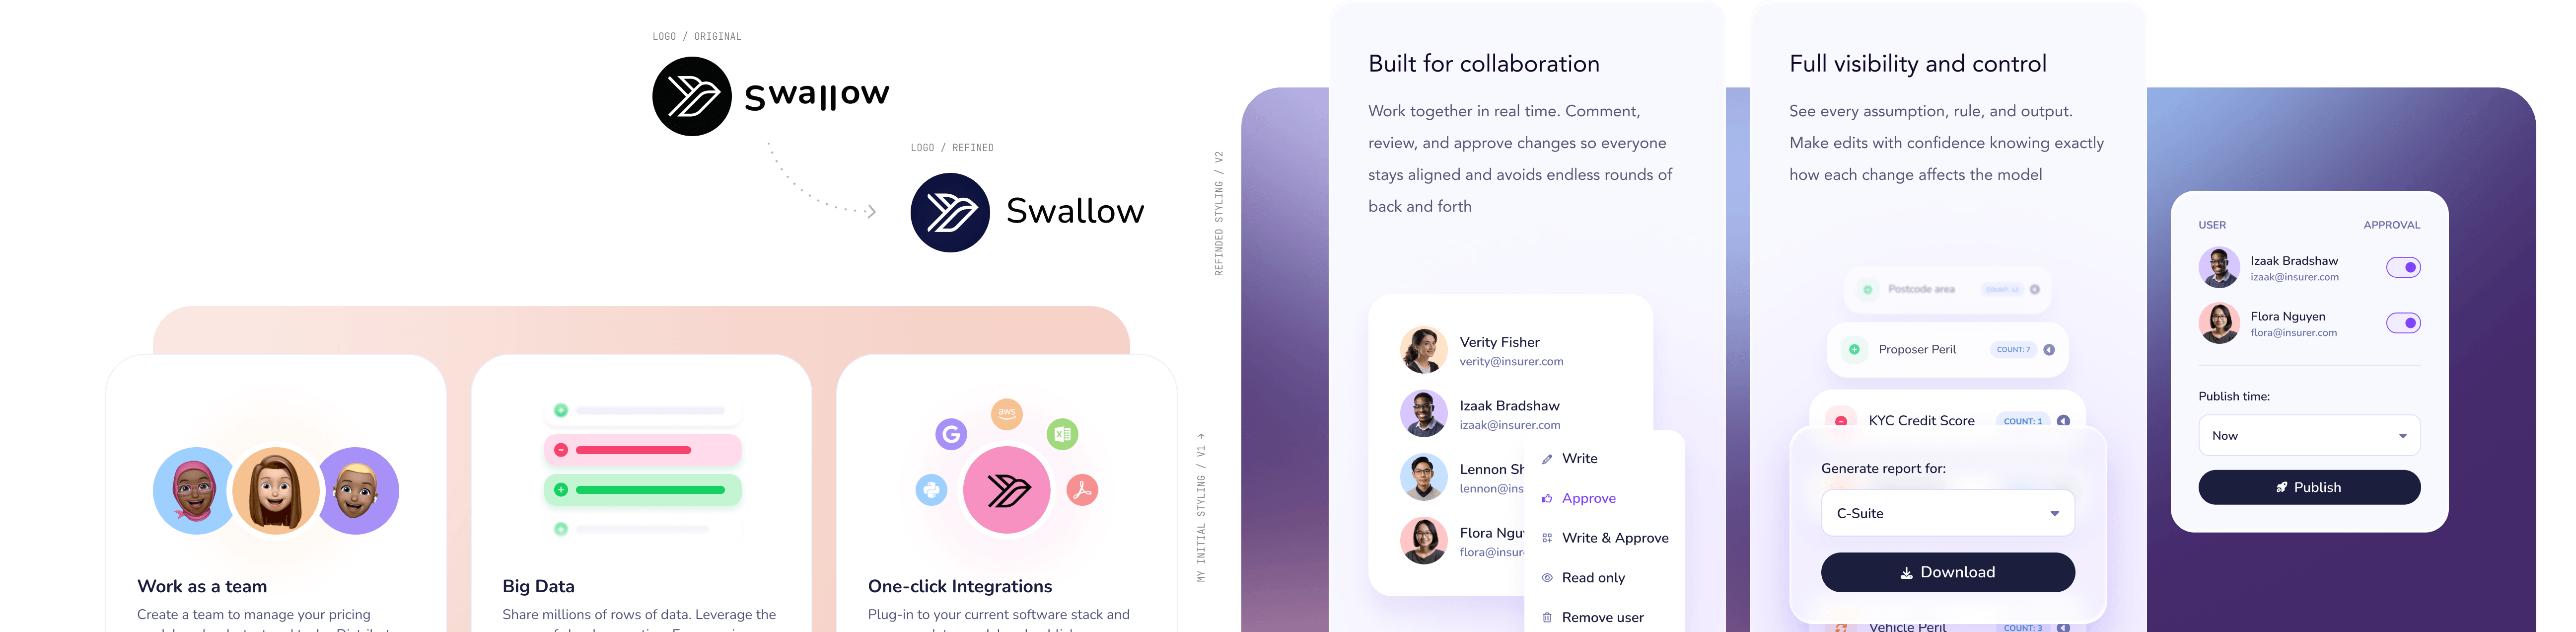
My first redesign gave Swallow a new visual foundation across brand, product and web. As the business matured, I continued to evolve that identity, introducing Avenir, refining the logo and strengthening the colour, graphic and motion systems around it.

The result is a more confident and recognisable Swallow, with a visual language flexible enough to move between product, website and wider brand without everything needing to look the same.

Comparison of two Swallow logos labeled 'Logo Original' with black and white design and 'Logo Refined' with a modern, blue circular background and cleaner font. Below, two UI style panels showcase features: left panel on a pink background with team avatars, data lines, and integration icons, highlighting teamwork, big data, and one-click integrations; right panel on a purple background showing collaboration with user list, user permissions with options to write, approve, or remove, report generation dropdown, data items with counts, approval toggles, publish time dropdown, and a publish button.

More than the interface

Design had a seat at the table from the start. As the company’s sole designer, I worked directly with the founder across product, UX, brand and web, often getting involved before there was even a screen to design

Over several years, my role grew far beyond delivering interfaces. I helped shape what we built, how it worked and how we took it to market, from early product thinking and roadmap conversations through to developer collaboration, launch and iteration.

It’s exactly the kind of relationship I enjoy most: working closely with founders, understanding the business as well as the interface, and contributing wherever thoughtful design can make the biggest difference.

Visit website
fFigma
wwebflow
AAfter Effects
PPhotoshop
JJitter
SScreen Studio
E11 Labs
Product Design
Product strategy
Web Design
Webflow development
Branding
Motion Design
Marketing
2023
Present
STATUS
●
ONGOING